How InvestLab's Strategies Performed in July — and How They're Positioned for August
By Stephane Renevier
Our framework at InvestLab is simple.
Start with a robust core portfolio designed to work across different economic environments — not just when stocks are rising. Add adaptive strategies that can respond as market leadership and the macro backdrop change (because they inevitably will). Then keep concentrated, high-octane ideas — AI, individual stocks or thematic trades — as satellites, rather than allowing one exciting thesis to dominate the entire portfolio.
The aim is not to avoid every loss. It is to maximise the chances that your portfolio keeps compounding toward its long-term goals — without a single bad regime, concentrated bet or deep drawdown knocking the plan off course.
Well, July offered a useful mini stress test of that approach.
The AI trade cracked hard enough to blow up one of its most prominent backers. Situational Awareness, the hedge fund founded by former OpenAI researcher Leopold Aschenbrenner, reportedly lost around 67% as leveraged AI positions triggered margin calls and forced asset sales. The lesson is not that AI is finished. It is that even a compelling long-term thesis can become dangerous when concentration and leverage leave no room for the market to disagree.
Traditional diversification did not provide much shelter either. The oil shock pushed inflation expectations and Treasury yields higher, so bonds fell alongside stocks and the standard 60/40 portfolio lost money.
Against that backdrop, both InvestLab strategies finished July in the green. The leveraged Lean All-Weather core portfolio gained 0.90%, while the Dual Momentum Pivot5 tactical strategy returned 1.14%. Global stocks fell 0.69%.
Since 2025, they have returned 41% and 39% respectively (after financing and transaction costs), outperforming global stocks' 36% gain. Across their long-term backtests since 1990, both also beat global stocks while taking significantly less risk.
What drove markets in July
The biggest move started in oil markets. Escalating hostilities around the Strait of Hormuz disrupted one of the world's most important energy routes, sending Brent crude above $100 and leaving oil more than 20% higher for the month.
That created an awkward problem for conventional portfolios. A supply-driven oil shock is inflationary, so Treasury yields rose rather than fell. The US 10-year ended July at 4.75%, markets moved to price roughly an 80% chance of a September rate hike, and long-dated Treasuries lost 4.5%. The asset normally expected to protect investors when stocks struggle became part of the problem.
Then technology cracked. During the final week of July, semiconductor stocks lost more than $1 trillion in market value as investors questioned whether the extraordinary pace of AI capital spending could continue. The Nasdaq fell 6.6%, while Asian memory and foundry stocks were hit particularly hard, dragging emerging markets lower.
For investors whose "diversified" portfolio was mostly US equities, technology funds and growth stocks, July felt very different from flat.
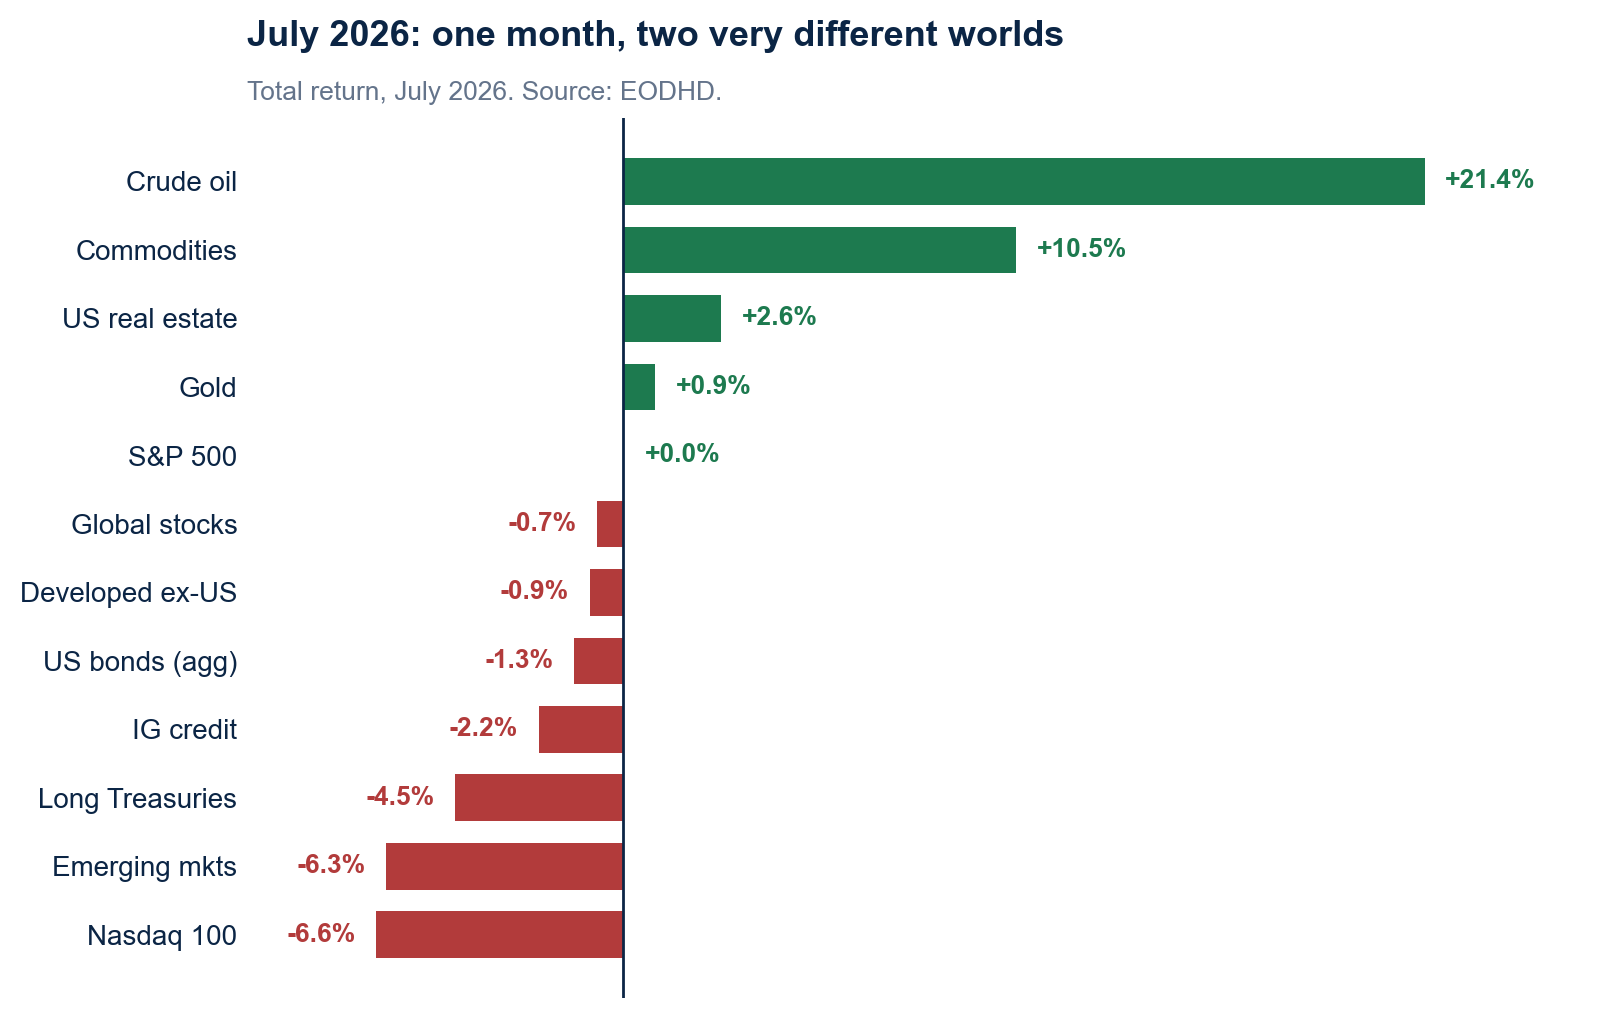 July 2026: one month, two very different worlds. Total return, July 2026. Source: EODHD.
What that did to "normal" portfolios
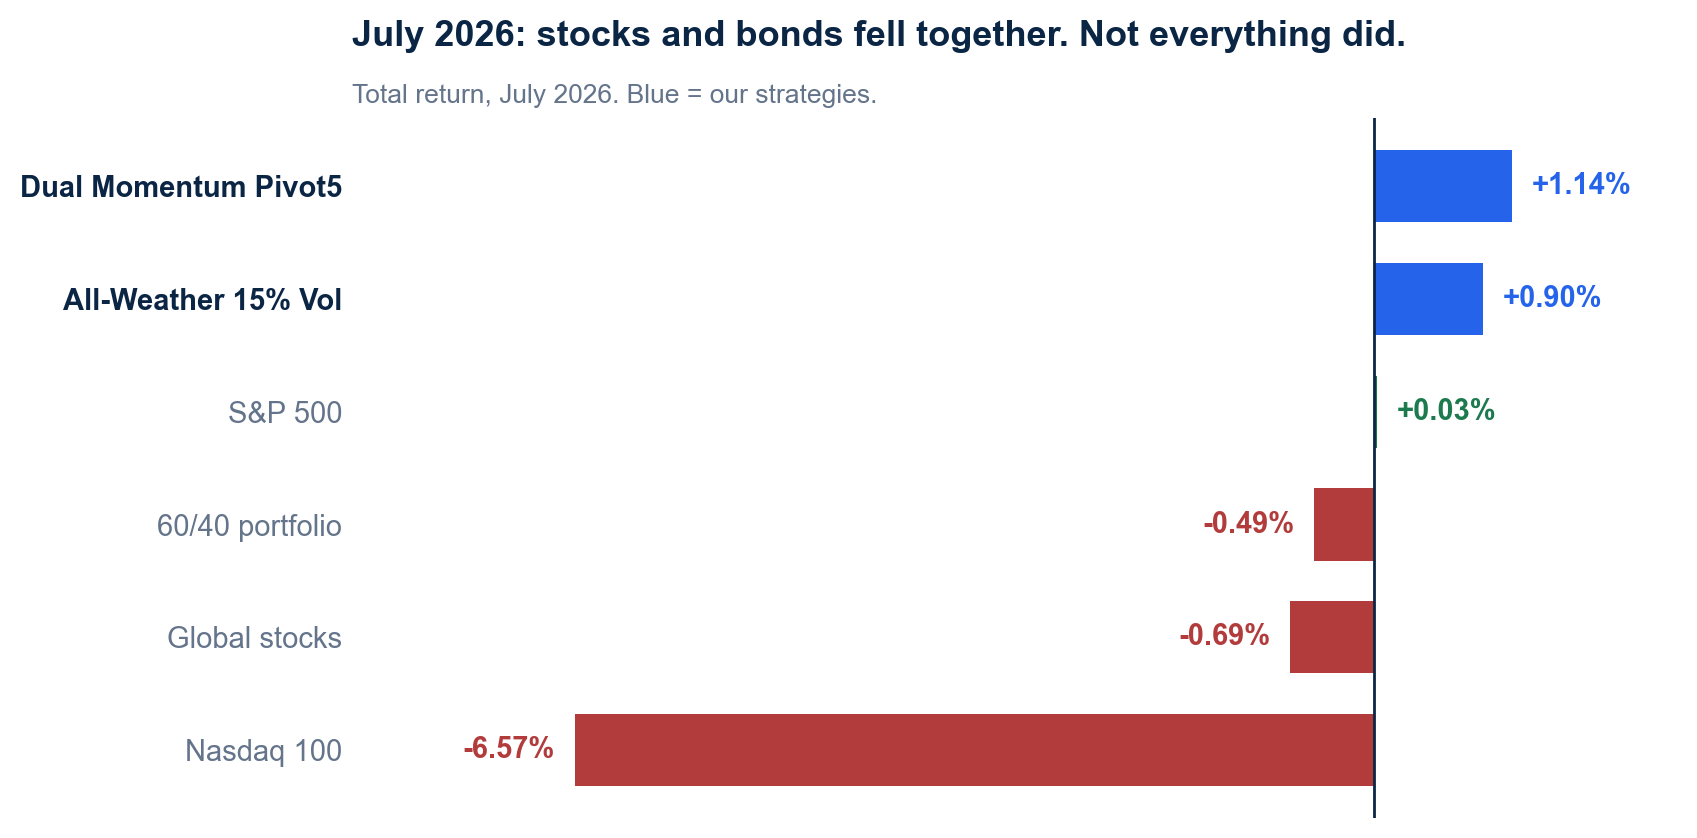 July 2026: stocks and bonds fell together. Not everything did. Blue = our strategies.
Now, here's how our core portfolio and tactical allocation strategy performed.
CORE PORTFOLIO
Lean, Leveraged All-Weather: +0.90% in July, +40.6% since 2025
A traditional 60/40 portfolio lost 0.49% because stocks and bonds struggled together. The month showed why the All-Weather portfolio holds four sleeves instead of relying on those two return engines alone.
The same oil shock that pushed bond yields higher sent commodities up 10.5%. That sleeve added 3.44 percentage points, more than offsetting the 2.57-point drag from Treasuries and carrying the portfolio to a 0.90% gain in July.
That is what the portfolio is designed to do: not avoid every loss, but find returns elsewhere when the usual stock-and-bond mix stops diversifying.
More impressively, it has also kept pace with a strong equity market in recent years. Since January 2025, the portfolio has gained 40.6%, compared with 36.1% for global stocks. More importantly, those returns came from several different places: commodities contributed 15.9 percentage points, gold 15.9 points and US equities 14.3 points.
Not every sleeve worked, of course. Long Treasuries detracted 0.5 percentage points, while financing costs reduced returns by another 5.0 points. Unlike many providers, we include those costs and deduct them from the headline return.
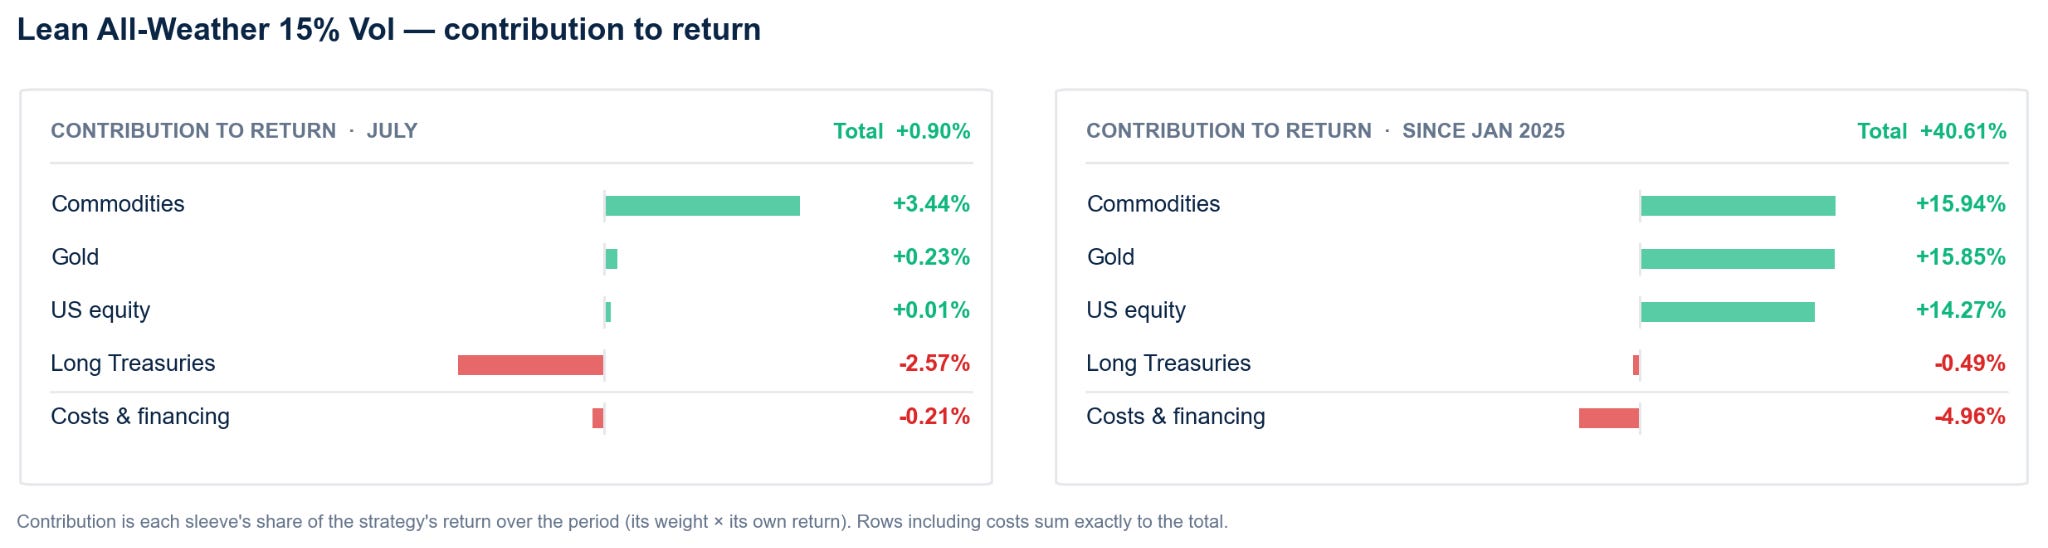 Contribution is each sleeve's share of the strategy's return over the period (its weight × its own return). Rows including costs sum exactly to the total.
It has also delivered those returns with less risk. Since January 2025, realised volatility was 15.3%, versus 16.6% for global stocks. Its Sharpe ratio was 1.50, compared with 1.27, and its worst drawdown was −11.3%, versus −16.5%.
Now, July should not be mistaken for proof that the structure always works smoothly or that it will never experience large drawdowns (it does: the portfolio lost 25% in 2022, its worst calendar year since 1990). But it does show that the portfolio can work in different environments, while keeping up with stocks over the longer term.
Across the full backtest since 1990, it returned 10.8% a year after financing and transaction costs (12.5% before costs), compared with 7.0% for global stocks. Its worst drawdown was −28.7%, versus −55.1% for the benchmark. Read the full deep dive to see how the strategy works, when it tends to perform well and where it can struggle.
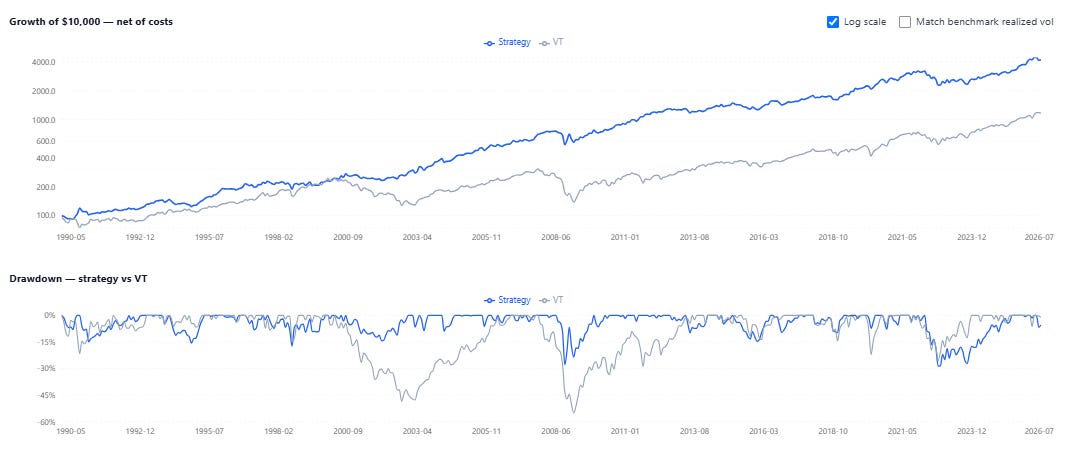 Growth of $10,000 net of costs, and drawdown, versus global stocks (VT). Backtested and hypothetical — see the disclosure below.
How it's positioned for August
No changes. The strategy rebalances quarterly and its last reset was in late June, so the next is due at the end of September. The strategy enters August at roughly 1.59x gross exposure.
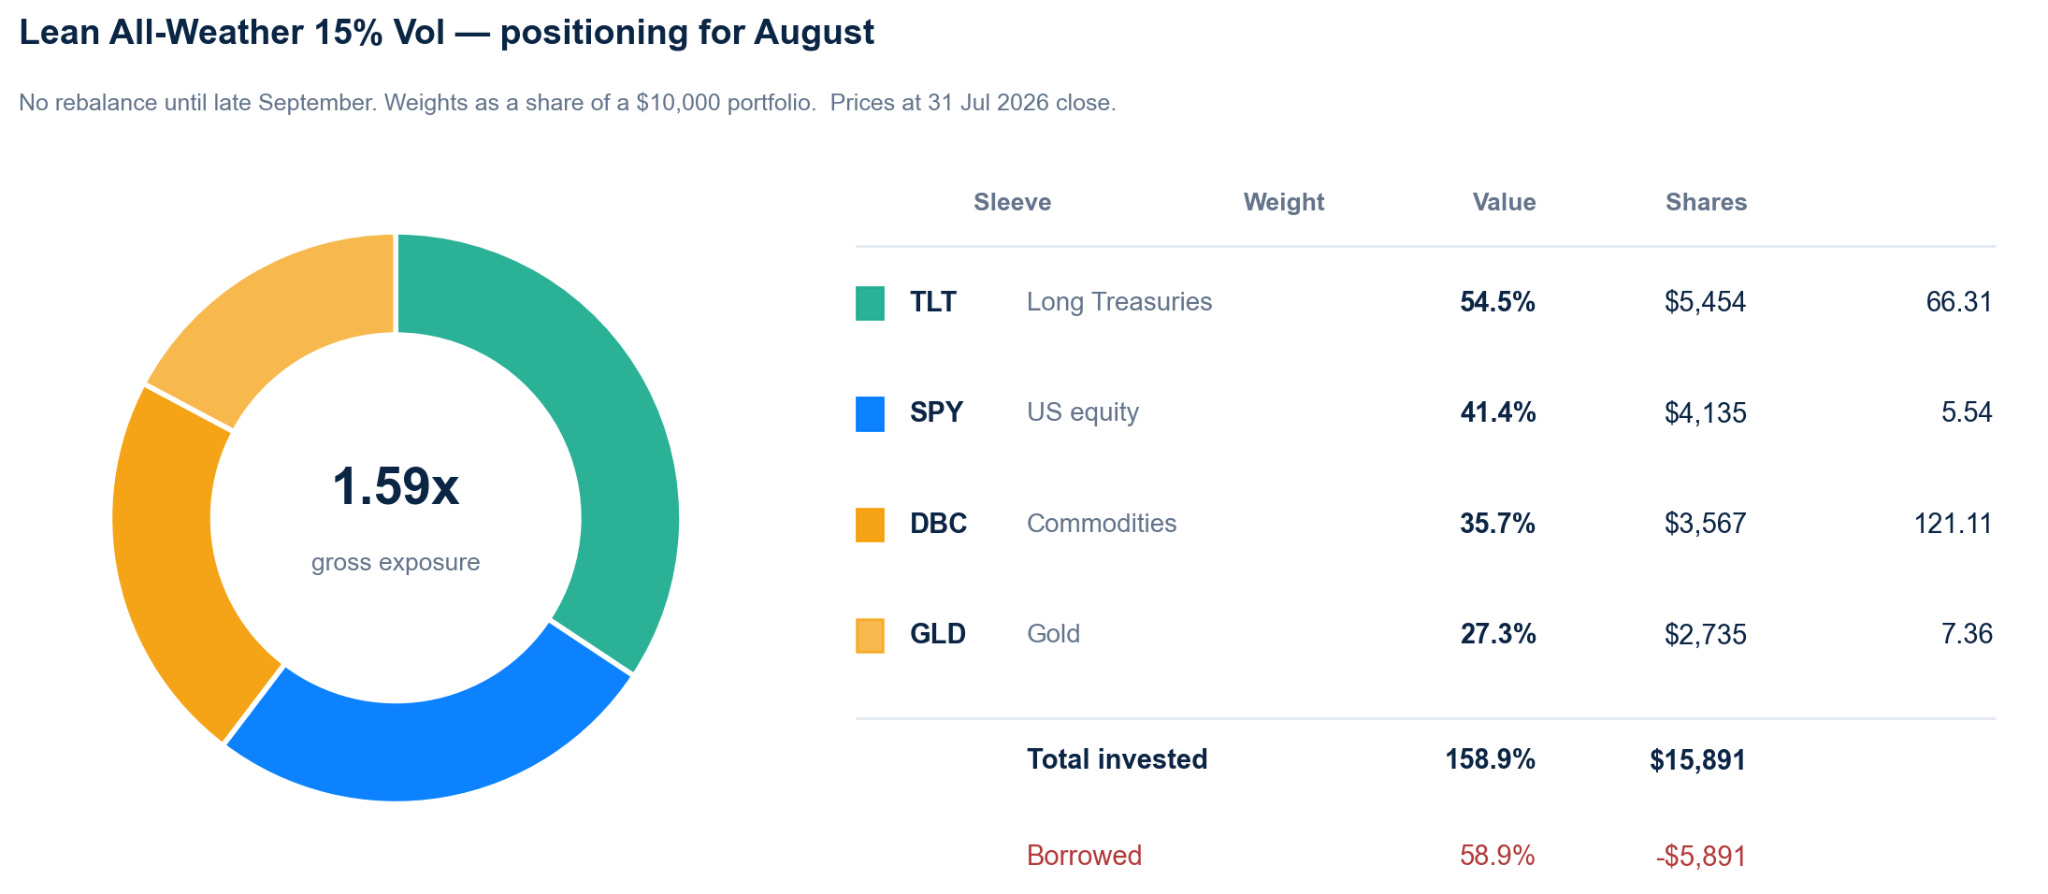 No rebalance until late September. Weights as a share of a $10,000 portfolio. Prices at 31 Jul 2026 close.
Rather than freeze one month's snapshot into this article, here is the live strategy — current weights, gross leverage, performance and next rebalance date, always up to date:
TACTICAL ASSET ALLOCATION
Dual Momentum Pivot5: +1.14% in July, +38.7% since 2025
Pivot5 entered July holding commodities, real estate and three equity sleeves. Commodities were the clear winner, adding 2.09 percentage points. Real estate — bought at the end of June to replace gold — added another 0.52 points. Emerging markets were the largest detractor.
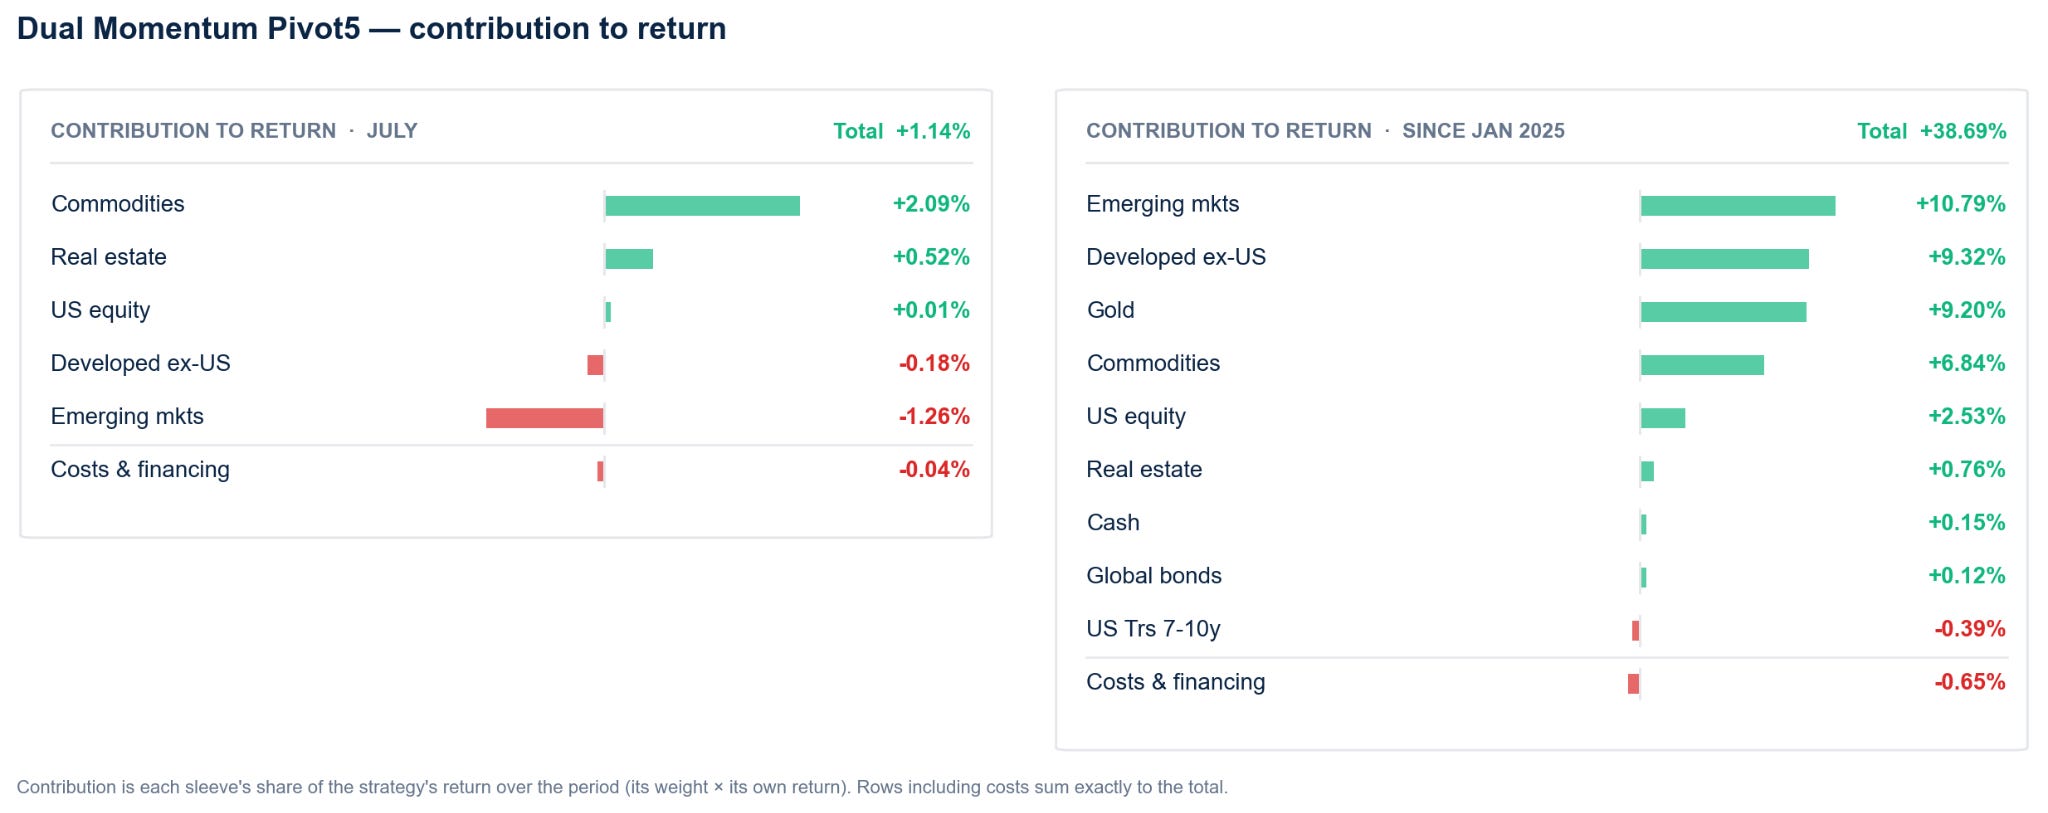 Contribution is each sleeve's share of the strategy's return over the period (its weight × its own return). Rows including costs sum exactly to the total.
Pivot5 has produced a steadier edge than the All-Weather portfolio. It returned 23.8% in 2025, versus 22.4% for global stocks, and is up 12.0% year-to-date, versus 11.2%.
Since January 2025, it has gained 38.7%, compared with 36.1% for global stocks. It achieved that with volatility of 13.9% and a worst drawdown of −11.0%, versus 16.6% and −16.5% for the benchmark.
It also did not rely on US stocks to generate those returns. Emerging markets, developed markets outside the US, gold and commodities all contributed more than the US equity sleeve.
That is the point of the strategy: follow whichever markets are leading rather than assuming yesterday's winner will remain tomorrow's.
It would have worked well since 1990, with the strategy generating 10.5% per year after costs (vs 7.8% for global stocks) and experiencing a maximum drawdown of only 17% (vs 55% for global stocks).
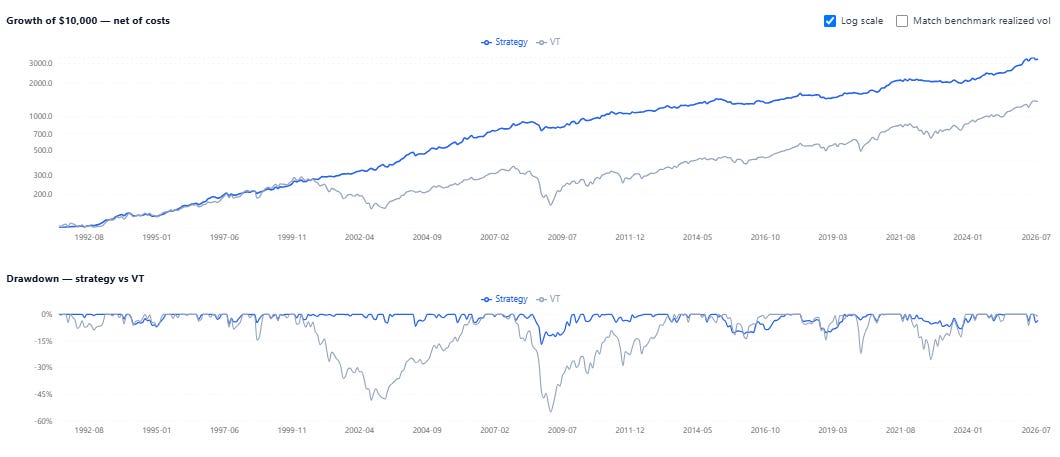 Growth of $10,000 net of costs, and drawdown, versus global stocks (VT). Backtested and hypothetical — see the disclosure below.
How it's positioned for August
There is no change to the holdings. The strategy remains equally invested in commodities, developed ex-US equities, emerging markets, real estate and US equities. It holds no bonds, gold or cash.
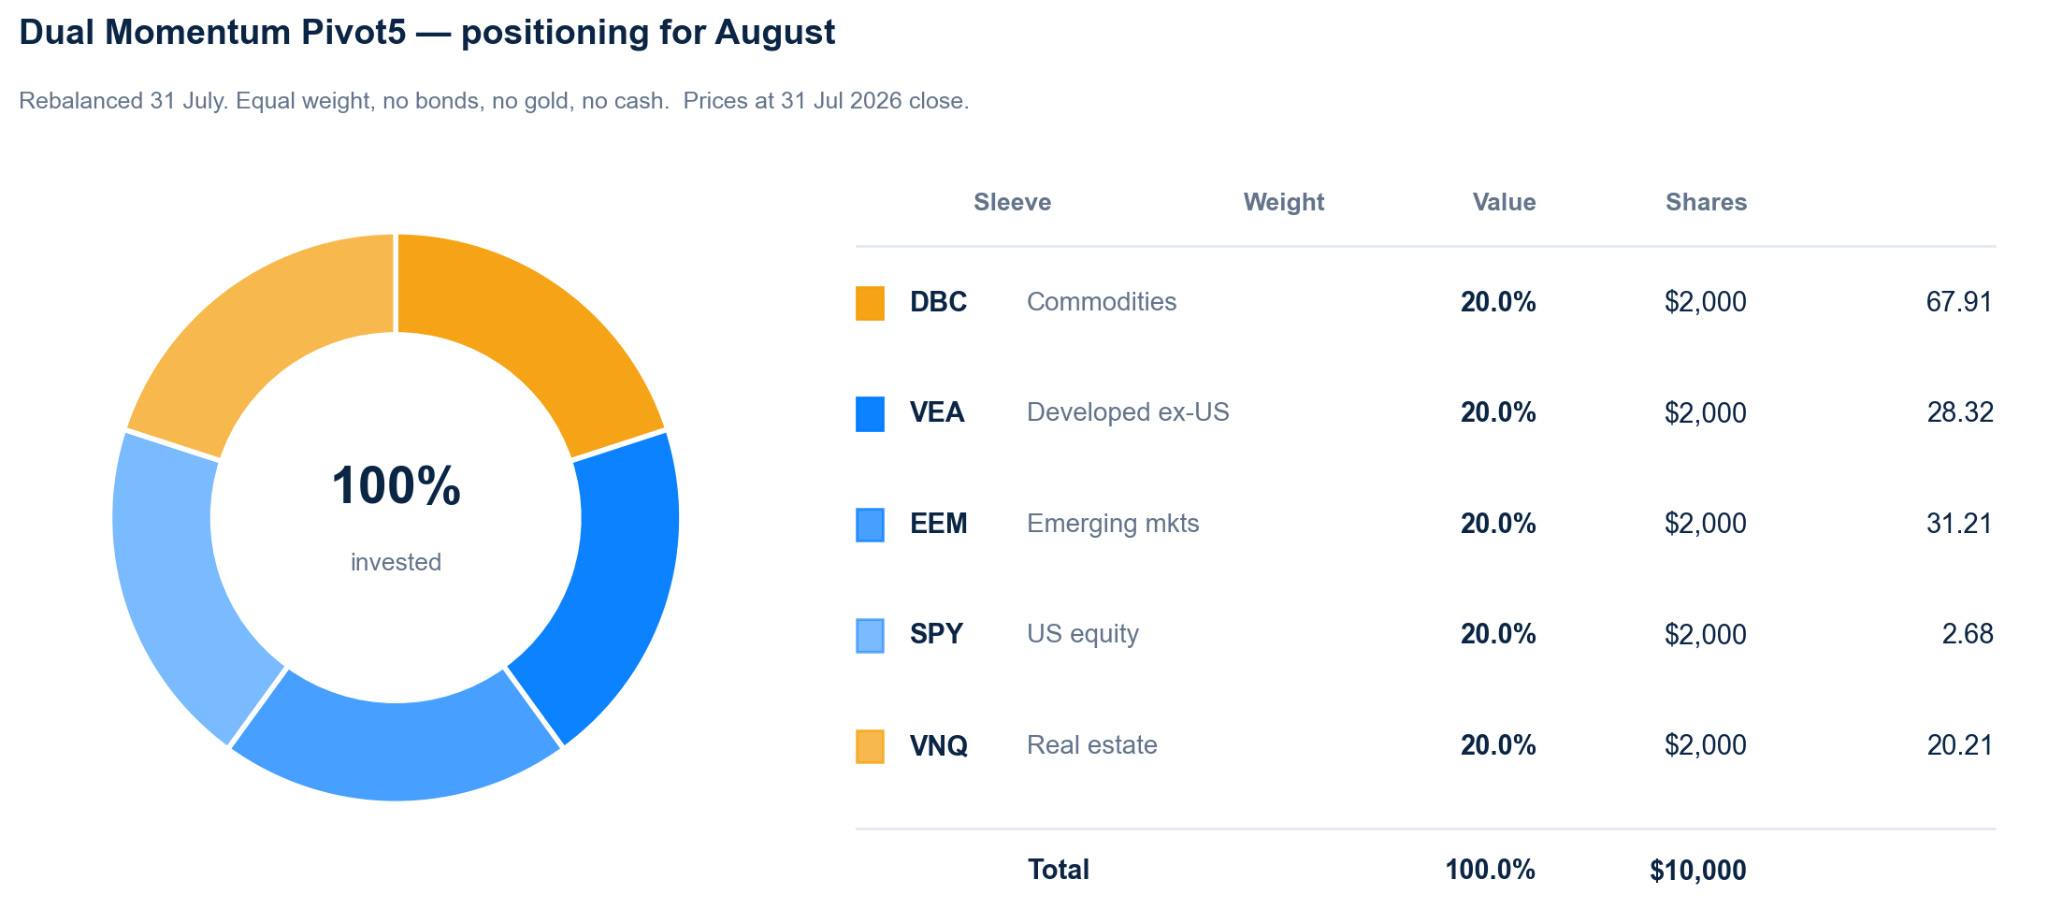 Rebalanced 31 July. Equal weight, no bonds, no gold, no cash. Prices at 31 Jul 2026 close.
And here is the live strategy, updated daily:
Follow both strategies live
Past performance is not a guide to future returns. Returns are simulated on live ETF prices and net of modelled trading and financing costs; they are not an audited track record. Long-term figures since 1990 are backtested and hypothetical, produced with hindsight, and subject to material limitations including proxy data and estimated costs. This is general information, not personal investment advice.
For information and education only — nothing here is investment advice. Backtested and live results are shown with their assumptions; past performance does not guarantee future returns.