The Levered All-Weather Portfolio, Rebuilt for DIY Investors
By Stephane Renevier
A four-ETF (or futures) all-weather portfolio — US large-cap (SPY), long Treasuries (TLT), broad commodities (DBC) and gold (GLD) — sized by risk rather than dollars and scaled with modest leverage toward a 15% annual volatility target. Over 1990–2026 the backtest compounded at 10.8% a year net of costs versus 7.0% for global stocks, at somewhat lower volatility (13.5% vs 15.4%) and roughly half the worst drawdown (−28.7% vs −55.1%). This is the full guide: the idea, the rules, the evidence, why it should keep working, where it could fail, and whether it's right for you.
PART I — THE IDEA
Start by admitting you don't know what comes next
The lean, levered all-weather strategy starts from one simple admission: nobody reliably knows what the economy or markets will do next.
So instead of building a portfolio that only works if you guess the next decade correctly, you build one designed to hold up across different environments — and then make sure it still has enough return potential to meet your investment goals.
Three principles do the work.
1. Own something for every kind of economic weather
Most people think "diversified" means owning lots of things. But 500 stocks is still one bet: that the economy keeps growing. When growth disappears, they all fall together. That's owning 500 raincoats and getting caught in a heatwave.
Real diversification means owning assets designed to work in different environments. In a simplified all-weather framework there are four broad regimes — and one asset in this portfolio is built for each.
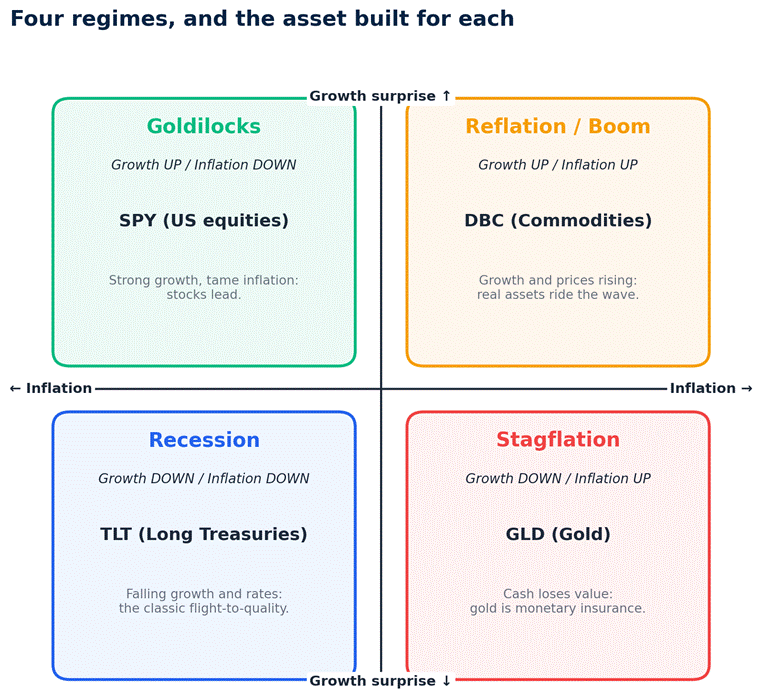 Four regimes, and the asset built for each. Growth surprises run up the page; inflation surprises run left-to-right (positive on the right).
The point of the mix is that something is always working. In any given regime one or two sleeves will look like dead weight — but that's the premium you pay so that when that bad weather finally arrives, you're covered. Back to the analogy, you can think of it as a wardrobe with a coat, sunglasses and an umbrella: most days some of it sits in the closet, but you are never completely caught out.
2. Size each asset by its risk, not its capital
Owning one asset per regime is only half the job; the next question is how much of each to own. This is where most portfolios go wrong.
A "60% stocks / 40% bonds" portfolio sounds balanced. It isn't — stocks move about three times as hard as bonds, so most of the portfolio's losses still come from the equity side.
The see-saw analogy is the clearest way to see it: put a 90 kg adult on one end and a 30 kg child on the other, and giving them "one seat each" balances nothing — the adult drops straight to the ground. To level it you move the adult toward the middle. Same idea here: you give the wild asset a smaller slice and the calm asset a bigger one, until each can move the portfolio by roughly the same amount.
That is all risk budgeting is: sizing assets by how much risk they contribute, not by how many dollars you put in.
3. Scale the balanced mix up
Once the portfolio is diversified and risk-balanced, a new issue appears: it is calmer than equities. That is useful — smaller swings, shallower drawdowns, a smoother ride — but the unlevered version may not deliver enough return for investors targeting high single-digit returns.
There are two ways to raise the return. The first is to concentrate back into equities. Simple, but it throws away the balance you just built.
The second is to scale the whole diversified portfolio up using moderate leverage. That is what this version does. The idea is powerful: if a diversified portfolio earns more return per unit of risk than equities, then leveraging it can produce higher returns than simply owning more stocks — at the same level of risk.
That's why we focus on building the best risk-adjusted, well-balanced mix first, then scale it with moderate leverage — rather than chasing return by piling into stocks.
The universe
When I ran institutional risk-parity and all-weather strategies, we spread risk across dozens of instruments — different regions, maturities, sectors and asset classes. A retail investor doesn't have that toolkit.
So this is the 80/20 version: keep the core economics, but deliver them through just four liquid ETFs (and/or futures) — one per regime, each clean and easy to trade, and ideally one with a futures or micro-futures contract so the leverage can be added efficiently.
I've deliberately kept it as simple as possible, so that even investors with smaller accounts can actually put it into practice — not just run it on paper. (In a follow-up article, I'll go deeper on implementation: how to run it as cost- and tax-efficiently as possible, including where micro-futures help and the minimum account size that makes the leverage practical.)
Why these four ETFs
- SPY is used for equities because it is liquid, cheap to trade, and has micro futures. A global equity ETF would be theoretically cleaner, but SPY is better for lean implementation.
- TLT is used for bonds because Treasuries are cleaner diversifiers than corporate bonds, which often behave like equities during stress. The long end gives more hedge per dollar, and has a micro futures contract for sizing leverage.
- DBC gives broad commodity exposure in one instrument. It is not perfect, but it avoids turning a simple strategy into a full commodity futures program.
- GLD is used for gold because it is liquid, simple, and gives direct exposure to the sleeve designed for stagflation, negative real rates and monetary stress. It also has micro futures.
| Asset class | ETF | Ticker | Risk budget | When it works |
|---|---|---|---|---|
| US equities | US Large Cap | SPY | 30% | Goldilocks — strong growth, low inflation |
| Gov. bonds | 20+ Year Treasuries | TLT | 30% | Recession — falling growth and rates |
| Commodities | Broad Commodities | DBC | 20% | Reflation — growth and inflation rising |
| Gold | Gold | GLD | 20% | Stagflation — inflation, negative real rates |
The risk budget is not the amount of capital invested in each asset. It is the share of the portfolio's overall ups and downs that each sleeve is intended to drive. SPY and TLT each target 30% of total portfolio risk because their long-term return foundations are stronger. DBC and GLD each target 20%, reflecting their primary role as diversifiers and regime protection.
Their long-term correlations support that design: the four assets are influenced by different economic forces and therefore do not usually move together.
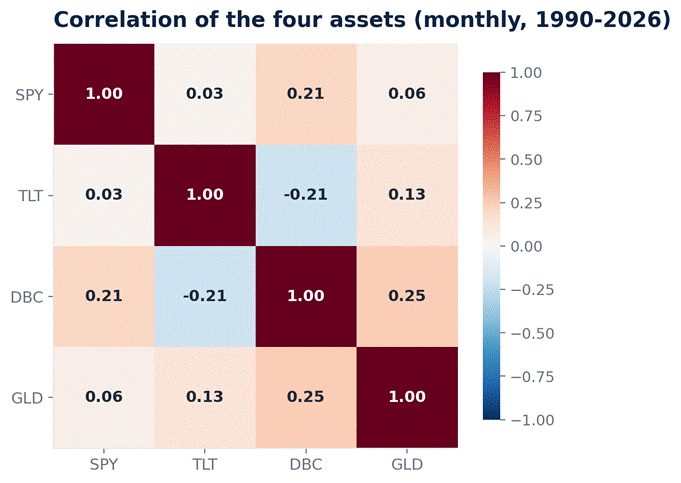 Correlation of the four assets. Loose pairwise links mean each asset contributes independent risk — exactly what a risk-budgeted mix needs.
The rules
Here's how the lean all-weather strategy works, step by step.
Step 1 — Solve for dollar weights
To turn "30% of the risk" into an actual position, the model reads two things about each asset: its volatility (how much it moves on its own) and its correlation (whether it moves the same way as the others). Together these give the number that matters: how much risk each dollar adds to the whole book. A dollar in something that swings hard and moves with the rest adds a lot of risk; a dollar in something that moves opposite the rest adds very little, because it offsets risk elsewhere.
And because volatility and correlation change over time, the weights aren't fixed — a sleeve is trimmed as it gets choppier or starts moving with the pack, and topped up as it calms or diversifies better. That way the portfolio adapts to the environment and remains balanced.
Step 2 — Scale the book toward the volatility target
Since the aim is to run closer to equity-like risk, the strategy scales the portfolio toward a 15% annual volatility target.
But leverage needs guardrails. First, total gross leverage is capped at 2×. Second, no single asset can exceed 80% of the book. Third, when deciding how much leverage to apply, the model floors correlations at zero — in other words, it never assumes negative correlations will keep reducing portfolio risk and justify a larger position.
That makes the strategy more conservative. Realised volatility may end up slightly below target, and some return may be left on the table. But that is worth it, as the biggest risk in a levered diversified portfolio is that diversification fails exactly when you need it most.
Step 3 — Rebalance quarterly
In this version, the portfolio rebalances only once per quarter.
Each reset trims what has risen and adds to what has lagged — a simple, systematic buy-low / sell-high discipline. It can help over full cycles, but not every quarter: in a prolonged sell-off, it means adding to the falling asset on the way down.
PART II — WHAT THE EVIDENCE SAYS
Headline results
Thirty-six years of history — read the way a portfolio manager would read it: returns, risk, costs and the lived experience, all tied to the same backtested strategy.
Over the full 1990–2026 backtest the strategy compounded at 10.8% a year against the benchmark's 7.0%. It also did so with lower volatility (13.5% versus 15.4%) and a much smaller worst drawdown: −28.7% versus −55.1%.
That came with trade-offs. The strategy lagged during strong equity bull markets, and leverage added financing costs. But overall, it delivered higher returns with a smoother path.
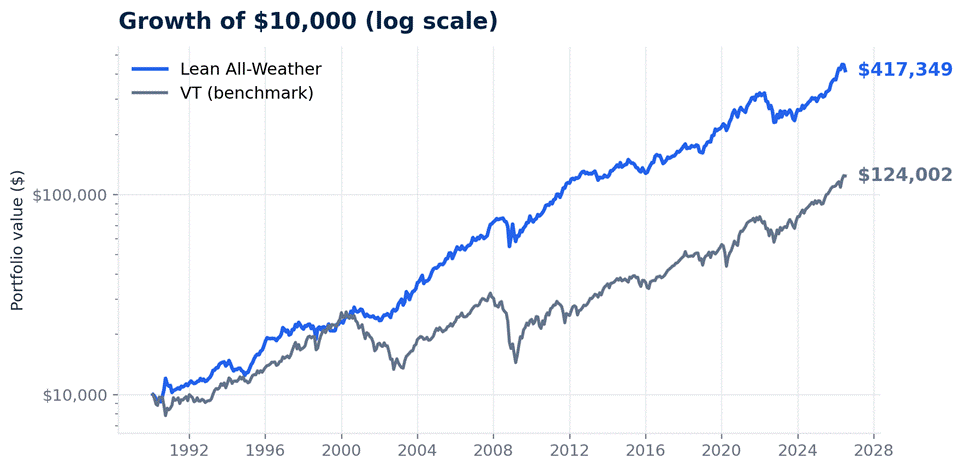 Growth of $10,000 — Lean All-Weather vs VT (log scale). The strategy grew $10,000 to $417,349 versus $124,002 for global stocks, along a far shallower path.
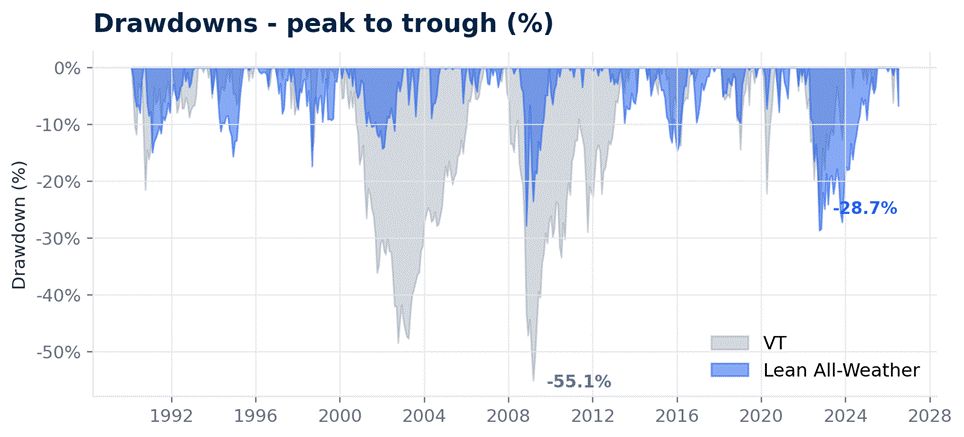 Drawdowns — distance below the prior peak. The strategy's worst fall was −28.7% versus −55.1% for global stocks.
And here's the full summary, side by side:
| Metric | Lean All-Weather | VT (benchmark) | Difference |
|---|---|---|---|
| CAGR (net) | 10.8% | 7.0% | +3.8pp |
| Volatility | 13.5% | 15.4% | −1.9pp |
| Sharpe ratio | 0.83 | 0.52 | +0.31 |
| Max drawdown | −28.7% | −55.1% | +26.4pp |
| Beta to VT | 0.45 | 1.00 | — |
| Correlation to VT | 0.51 | 1.00 | — |
| Best calendar year | +43.5% (1995) | +32.7% (2009) | — |
| Worst calendar year | −24.9% (2022) | −40.9% (2008) | — |
| % positive months | 63.0% | 61.4% | +1.6pp |
| Gain / loss ratio | 1.89 | 1.47 | +0.41 |
| Skewness | −0.31 | −0.61 | less negative |
| Avg gross leverage | 1.71× | 1.00× | — |
| Growth of $10,000 | $417,349 | $124,002 | 3.4× |
The table also shows a better downside profile: gains were larger relative to losses, monthly wins were slightly more frequent, skew was less negative, and the worst calendar year was much milder. In plain English, the strategy's losses tended to be smaller and less extreme, making the long-term path more predictable.
Of course, leverage and rebalancing are not free. The backtest includes financing and trading costs, which reduced gross returns by an estimated 1.7 percentage points per year:
| Line item | Estimate | Note |
|---|---|---|
| Return before costs | 12.5% CAGR | Gross of financing and trading |
| Costs & financing drag | −1.7 pp / yr | Reconciled to net CAGR |
| financing rate on borrowed capital | ≈ 2.4% / yr | On avg 1.71× gross (≈0.7× borrowed) |
| trading cost | ≈ 0.06% / yr | Turnover ≈ 30% / yr on liquid ETFs |
| Net return | 10.8% CAGR | After all costs |
Read the financing line as a rate, not a drag: ≈2.4% a year charged on the ≈0.7× that is actually borrowed works out to ≈1.7pp of annual return, which together with ≈0.06% of trading cost is what separates the 12.5% gross from the 10.8% net.
Historical holdings and leverage
Over the backtest, TLT carried the largest capital weight — ranging from 19.3% to the 80% cap and averaging 65.1%. Average weights were 45.4% in SPY, 29.7% in DBC and 32.7% in GLD. Gross exposure ranged from 1.24× to 2.00× and averaged 1.71×. The large bond weight should be read as an outcome of the construction process — the calmest asset needs the most dollars to reach its risk share — not as a directional bet on Treasuries.
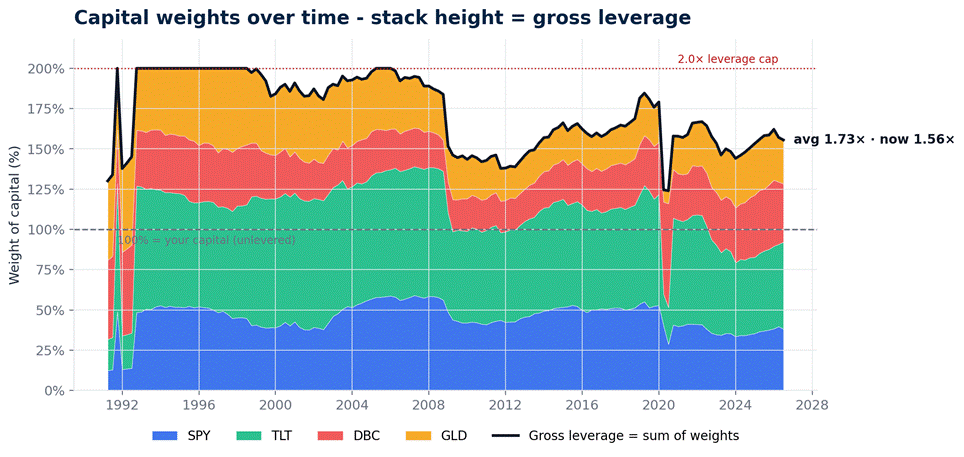 Capital weights over time. The calm Treasury sleeve carries the most capital — a mechanical result of risk targeting; the height of the stack is gross leverage, averaging 1.7×.
Where it outperformed — and why
Relative to the benchmark, the strategy's best years were the benchmark's worst — the defensive sleeves earned their keep exactly when equities didn't.
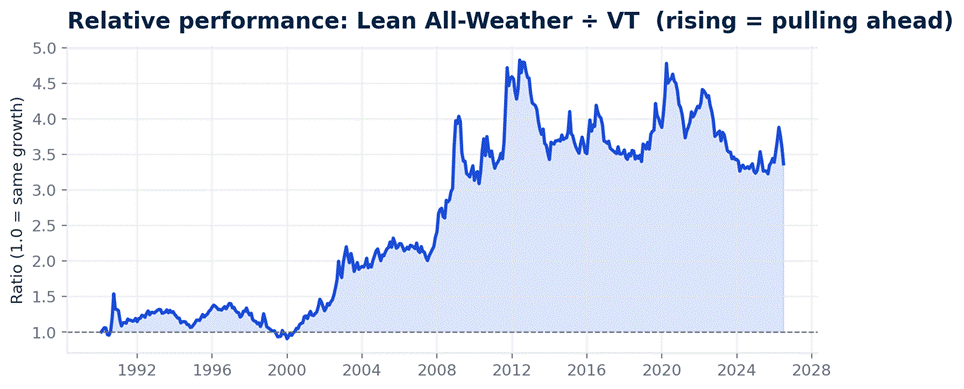 Relative performance: strategy ÷ VT (rising = pulling ahead). The outperformance was earned in steps, concentrated in the equity bear markets of 2000–02, 2008 and the years around them.
The ratio line does its climbing in steps, and the steps line up with the equity drawdowns. The mechanism is the same each time. When global stocks fell it was usually because growth was disappearing — the dotcom bust through 2000–02, the global financial crisis in 2008, the eurozone strain in 2011. That low-growth weather is where long-term Treasuries do their work as recession protection, and gold holds its footing when policy turns drastic. Because risk budgeting hands the calmest sleeve a large capital weight, a bond rally moves the whole portfolio rather than nodding politely from the corner.
Here's how the strategy performed in every calendar year since 1991 versus VT.
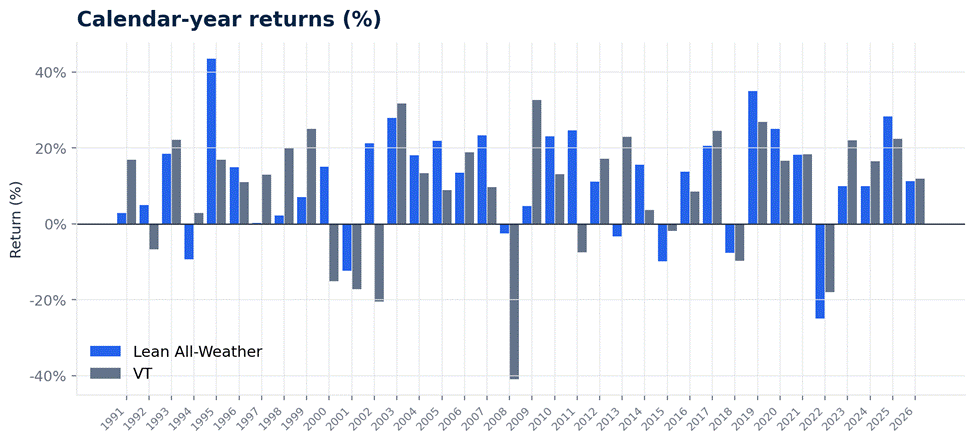 Calendar-year returns. The strategy's up years are less spectacular than the benchmark's best, but its down years are far shallower.
Read the absolute side too. In several of those years the strategy didn't merely lose less than stocks — it made money outright while global equities fell double digits: +15.1% in 2000 (VT −15.1%), +21.2% in 2002 (VT −20.5%) and +24.6% in 2011 (VT −7.5%), and it gave back only −2.6% in 2008 while VT collapsed −40.9%. That is the trade in action: you give up ground when equities run, and get it back — with interest — when they break.
Where it lagged — and why
Two environments hurt: strong bull markets when equities go ballistic (think the late-1990s tech run) and sharp V-shaped recoveries (2009, 2019–20). When the benchmark runs on pure equity beta, a mix that keeps most of its risk elsewhere gets left behind — and in this run that happened in more than four years out of ten.
The pattern is structural, not bad luck. Because risk is budgeted across four assets, equities carry only a 30% risk share, so a market that runs on stocks alone leaves the mix flat-footed. In absolute terms it also lost money outright in a handful of years: 1994's Fed-tightening bond selloff, 2001's dotcom bust, 2015's China devaluation, 2018's Q4 rate scare, and 2022's twin bear in stocks and bonds, where diversification thinned exactly when it was needed.
The behavioural bill: 44.3% of rolling 12-month windows finished behind the benchmark, and the worst of those trailed by 34.6 percentage points (through March 2021, as post-COVID equities ripped and the defensive mix lagged). The running costs skim the top too — financing on the average 1.71× gross exposure cost an estimated 1.7pp a year, and turnover of about 30% a year cost roughly 0.06%.
Living with the strategy
Holding this meant sitting underwater for stretches measured in years, not months — but never falling as far as owning global stocks alone would have. "Underwater" just means below your last high-water mark. The strategy's worst such spell ran 41 months.
The deepest fall came in 2022, when stocks and long Treasuries dropped together. On a $100,000 stake you'd have watched roughly $28,662 evaporate at the trough — worse in that window than the ~$25,500 the benchmark shed, because leverage sat on top of a mix whose usual shock absorber was falling too. It took until June 2025 to fully recover.
The strategy's worst five drawdowns
| Peak | Trough | Recovery | Depth | Decline | Recovery |
|---|---|---|---|---|---|
| Dec 2021 | Sep 2022 | Jun 2025 | −28.7% | 9 mo | 33 mo |
| Jun 2008 | Oct 2008 | Nov 2009 | −27.8% | 4 mo | 13 mo |
| Sep 1997 | Aug 1998 | Dec 1999 | −17.4% | 11 mo | 16 mo |
| Jan 1994 | Nov 1994 | May 1995 | −15.7% | 10 mo | 6 mo |
| Sep 1990 | Jan 1991 | Jan 1993 | −14.9% | 4 mo | 24 mo |
VT's worst five drawdowns
| Peak | Trough | Recovery | Depth | Decline | Recovery |
|---|---|---|---|---|---|
| Oct 2007 | Feb 2009 | Jul 2013 | −55.1% | 16 mo | 53 mo |
| Mar 2000 | Sep 2002 | Oct 2006 | −48.4% | 30 mo | 49 mo |
| Dec 2021 | Sep 2022 | Dec 2023 | −25.5% | 9 mo | 15 mo |
| Jan 1990 | Sep 1990 | May 1993 | −25.3% | 8 mo | 32 mo |
| Dec 2019 | Mar 2020 | Aug 2020 | −22.2% | 3 mo | 5 mo |
Here's the lived experience swung by 5-year segments.
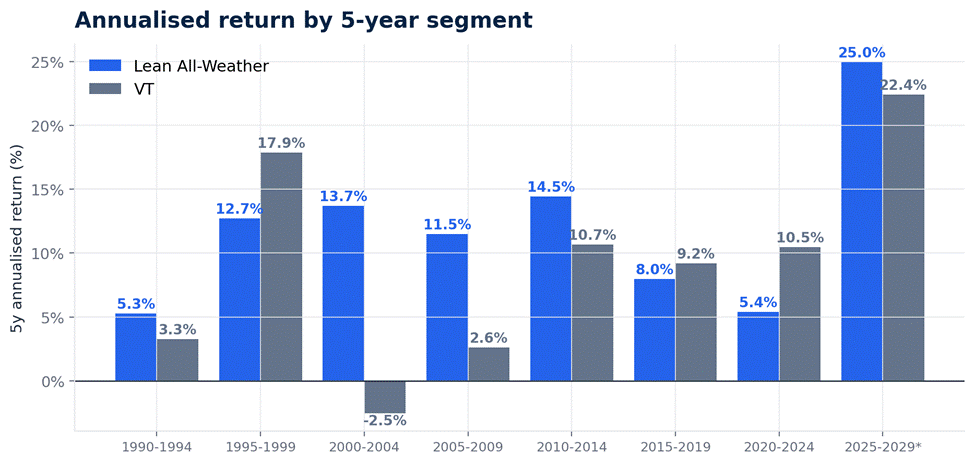 Annualised return by 5-year segment. The mix earned its edge in the 2000–04 bust and the 2005–09 crisis window, and lagged in equity-led stretches like 2020–24. The final period covers less than five years.
The 2000–04 dotcom bust (13.7% annualised while the benchmark lost ground) and the 2005–09 crisis window (11.5% vs 2.6%) rewarded patience. The 1995–99 tech run tested it — 12.7% while global stocks did 17.9%. And the most recent full segment, 2020–24, was the weakest relative stretch: 5.4% against the benchmark's 10.5%, dragged by the 2022 twin drawdown.
Here's how each asset contributed to the portfolio's return.
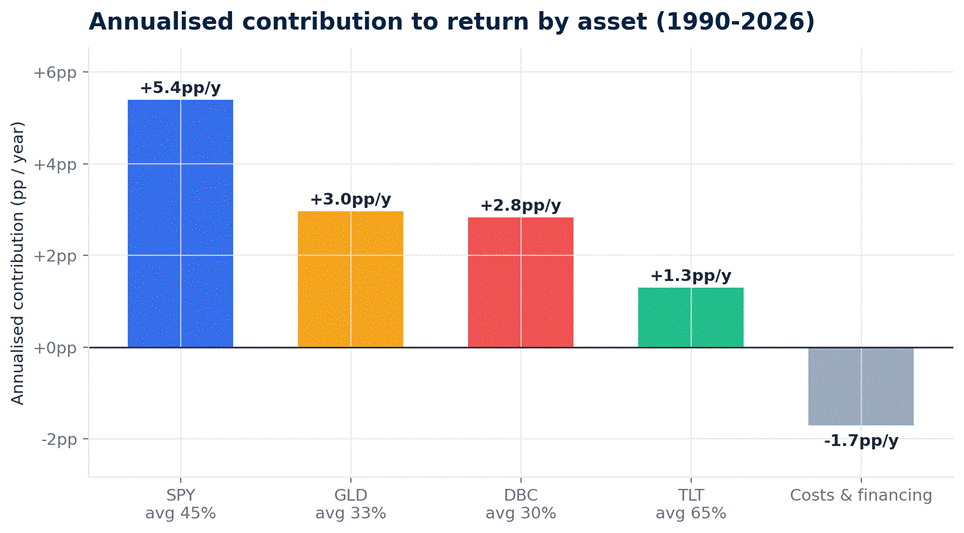 Annualised contribution to return by asset. Return came from multiple sleeves — equities most (+5.4pp/yr), then gold and commodities — with financing and trading costing about 1.7pp/yr.
Each bar is one sleeve's capital weight times its return, so a big bar reflects a big weight as much as a strong asset. Over the full run US Large Cap added 5.4pp a year, Gold 3.0pp, Broad Commodities 2.8pp and the 20+Y Treasury sleeve 1.3pp (it was the biggest contributor up until 2021); financing and trading took back 1.7pp — and the net is the 10.8% CAGR.
The range of outcomes
The strategy's yearly returns bunch more tightly than the benchmark's — so you're likelier to land near the typical result and far less likely to hit the extremes, especially the big losses.
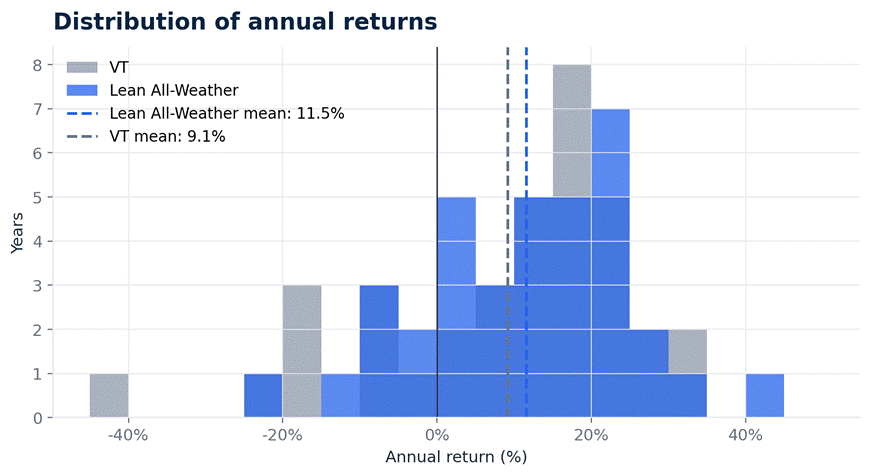 Distribution of annual returns. Returns cluster more tightly around the mean, with fewer extreme losses than global stocks.
The strategy did what it was designed to do: limit the downside while still capturing a meaningful share of the upside. On the left-hand side, the highlighted years show smaller losses than the benchmark. On the right-hand side, the strategy often participated in strong markets too — although, as expected, it did not keep pace with equities in roughly half of the up years.
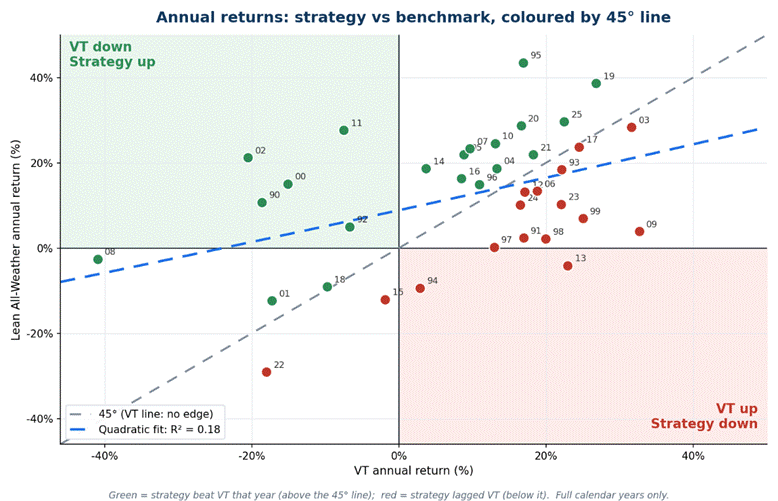 Year-by-year: strategy vs benchmark. Above the diagonal, the strategy beat the benchmark that year; the fitted curve flattening on the left is the point — in the benchmark's worst years, the strategy's losses were much shallower.
The strategy never lost money over five-year periods in the backtest, and outcomes were more stable than global stocks.
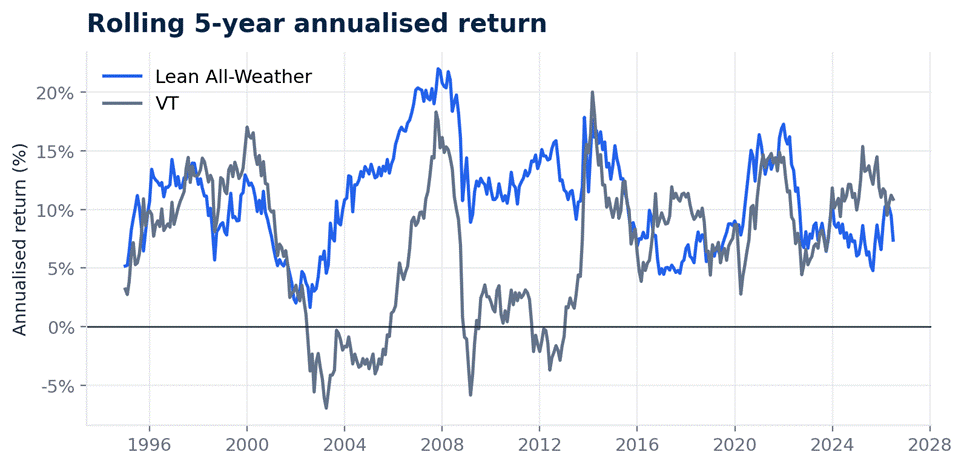 Rolling 5-year annualised return. The strategy's range of outcomes is far tighter than the benchmark's, and it never dipped below the zero line.
At longer horizons results were even better. Across 319 rolling 10-year windows the strategy had zero negative ones; its worst 10-year stretch still annualised 5.8%. The benchmark had 22 negative 10-year windows, with a worst of −3.4%.
An important note on the backtest
As with any backtest, the future won't look exactly like the past. Three things are worth keeping in mind.
- The numbers are estimates, not reality. Transaction costs, financing costs, taxes and implementation details vary from investor to investor. Where today's ETFs didn't exist, I used the closest available proxies to extend the history. Think of the results as a reasonable approximation of what could have happened, not a precise record of what you would have earned.
- This is just one market history. The backtest includes a unique mix of environments: a long decline in interest rates, a commodity supercycle, three major bear markets, and one of the strongest periods ever for US equities. Different market conditions would have produced different results.
- Backtests become dangerous when they're overfitted. That's less of a concern here. We estimate a small number of parameters and the results are not sensitive to them.
None of this makes the backtest meaningless — far from it. It just means you have to read it the right way.
Of course, the historical backtest is only the first step. The second is understanding why it works in the first place, and whether there's good reason to expect that to continue — which is exactly what we turn to next.
PART III — WHY IT WORKS
Why it works, and why it should keep working
The strategy rests on three durable ideas.
1. Strong economic rationale
The portfolio owns four assets built for different regimes: SPY for growth, TLT for recession and disinflation, DBC for reflation, and GLD for stagflation or monetary stress.
One or two sleeves can struggle at any point. But it is unlikely that all four stay impaired for long, because the economy cannot be in every regime at once. Over time, something in the mix should have a fundamental reason to work.
2. Risk adapts to the environment
This is not a fixed-weight portfolio. Weights adjust as volatility and correlations change. When an asset becomes more volatile or less diversifying, its weight falls. When it becomes calmer or more useful, its weight can rise.
Risk is therefore managed directly, rather than accepted passively.
3. It doesn't rely on a single environment
The exact backtested return may not repeat. It benefited from the market path from 1990 to 2026. But equities also enjoyed one of their strongest long-term periods, helped by falling rates, easy money, globalisation, rising margins and expanding valuations. Many of those tailwinds are now weaker, and some could become headwinds.
That does not mean stocks will fail. It means relying almost entirely on equities is a bigger bet than many investors realise. A portfolio spread across growth, recession, inflation and stagflation should be better prepared if the next decade is less friendly to easy equity beta.
PART IV — WHERE IT COULD FAIL
Where the strategy could fail
The strategy is built on diversification, but diversification is never guaranteed. The main risk is that the portfolio proves less balanced in the real world than it looks in the model.
1. Instrument selection risk
This is a lean version: one asset per regime. That keeps it simple, but it creates proxy risk.
SPY is US large-cap equities, not global equities. If the US underperforms, the equity sleeve underperforms. TLT is long-duration Treasuries, not bonds broadly, so it carries meaningful rate and term-premium risk. DBC is one broad commodity basket, not a full commodity program that can rotate across sectors.
2. Proxy risk
The framework assumes each asset helps in its assigned environment: SPY for growth, TLT for recession and disinflation, DBC for reflation, and GLD for stagflation or monetary stress.
That may not always be true. If the assets do not behave as expected, the portfolio is less balanced than intended.
3. Correlation risk
The biggest risk is diversification failure. The strategy needs the four sleeves to behave differently. In a liquidity shock, that can break: correlations rise, assets fall together, and the portfolio starts behaving like one risk asset.
And because the book is levered, losses are amplified when diversification is offering the least protection. 2022 was the historical example: stocks and long Treasuries fell together, the strategy lost 24.9% for the year, and the peak-to-trough drawdown reached −28.7%. Future drawdowns could be worse if several sleeves sell off together.
4. Financing drag
Leverage has a cost. The strategy averaged 1.71× gross exposure, and that cost roughly 1.7 percentage points of return a year. When rates are low, that drag is manageable. When rates are high, it becomes a much bigger hurdle. If you can't get cheap financing (more on that in the next deep dive), the benefit of leverage can shrink or disappear.
5. Implementation friction
The model uses backward-looking volatility and correlation estimates, so it can only react after risk has already changed. It may size positions based on yesterday's calm just as today's storm begins.
Quarterly rebalancing also has a cost in falling markets. Buying what has lagged can help over full cycles, but in a prolonged sell-off it means adding to the asset that keeps falling. These are smaller risks than diversification failure or financing drag, but they still matter.
PART V — IS IT RIGHT FOR YOU?
Is it the right strategy for you?
This strategy fits a particular worldview: that the future may look nothing like the past, and that you're honest enough to admit you can't reliably predict which regime — boom, recession, inflation, stagflation — actually shows up. If that describes you, this is built to be a starting point rather than a bet: not a portfolio that wins if you call the next decade right, but one designed to hold something for every decade.
The temperament matters as much as the view, though. Its hardest test isn't a crash — it's the long stretches where it lags a roaring equity bull market and you have to watch friends in an all-stock portfolio pull ahead for years without abandoning ship. If you'd quit during that, the strategy can't work for you no matter how sound the design is.
There's also a practical bar, because this version uses leverage. That makes it an advanced-investor tool. You need access to cheap leverage — ideally through futures or micro-futures rather than expensive margin — because financing cost comes directly out of your return and never stops. You need to genuinely understand what leverage does in a drawdown: it deepens the fall, and in a forced-selling situation it can turn a temporary loss into a permanent one.
And you need to be comfortable, in advance, with drawdowns in the 30%+ range. If any of that gives you pause — no cheap borrowing, or leverage simply isn't something you want to run — that's not a failing, it's a signal: the unlevered version of all-weather keeps the same regime logic and the same balance, just with smaller swings and a lower return. It's the honest place to start. Either version is best held in a tax-advantaged account, given the turnover and financing.
But if you understand the trade-off — that you're giving up the chance to ride a single roaring asset in exchange for a book that should stay standing across a far wider range of conditions, and that this design is meant to dampen and survive bad regimes rather than profit from them — then this can be a genuinely strong core holding. It won't be the best performer in any one environment; that's the point. It aims to be the one portfolio you can actually hold through all of them.
The portfolio today
The strategy rebalances at the end of each quarter. Rather than freeze one quarter's positions into this article, here is the live strategy — current weights, gross leverage, performance and next rebalance date, always up to date:
Important information — please read. This guide is published by InvestLab for educational and informational purposes only and does not constitute investment advice, a personal recommendation, regulated advice, investment management, or an offer or solicitation to buy or sell any financial instrument. InvestLab is not authorised or regulated by the FCA or any other financial regulator, and reading this guide, subscribing, or corresponding with the author does not create an adviser-client or fiduciary relationship. The strategy is presented as a systematic portfolio construction case study and may not be suitable for your objectives, financial situation, tax position, risk tolerance or jurisdiction. All backtested performance is hypothetical, produced with hindsight, and subject to material limitations, including proxy data, estimated costs, liquidity assumptions, financing assumptions, taxes, slippage, and the risk that live results fall short of historical results. Past performance, whether actual or hypothetical, is not a reliable indicator of future returns. The strategy uses leverage, can lose money, may underperform equities for long periods, and could suffer losses larger than those shown historically. The author may invest in this strategy or related instruments, and InvestLab is a commercial product, so conflicts of interest may exist. Nothing here is tax advice, and you should consult an authorised financial adviser and/or tax professional before acting. You alone are responsible for your investment decisions, and InvestLab and its author accept no liability for losses arising from the use of this material.
For information and education only — nothing here is investment advice. Backtested and live results are shown with their assumptions; past performance does not guarantee future returns.