A Cheaper Way to Hedge Bear Markets, Built for European Investors
By Stephane Renevier
A few weeks ago we published our third deep dive, on Adaptive Hedge, a simple monthly strategy that protects a stock-heavy portfolio in deep bear markets by holding the two defensive assets with the strongest trends. It made money in the dot-com bust, the GFC, COVID and 2022, and unlike most hedges it earned more than cash over time.
But it was built for US investors, with US ETFs that Europeans can't buy. This post shows how to adapt it for Europe: which funds to use, what changes when you measure everything in euros, and what to watch out for. We won't re-explain how the strategy works or why; if you haven't read the original, start there.
PART I — WHAT CHANGES FOR EUROPEAN INVESTORS
What changes for European investors
Adaptive Hedge works in Europe too. You just can't buy the same funds, and a few of them behave differently once you measure everything in euros. Here's what changes, why, and whether it still works.
Why you need a European version
Deep Dive #3 built Adaptive Hedge for an investor who holds US ETFs and counts their money in dollars. If you live in Europe, three things get in the way.
- You can't buy the US funds. Brokers in Europe block US ETFs, so you need European (UCITS) equivalents.
- Your results are in euros, so the trend test should use euro returns.
- Two hedges change in euros: UUP becomes a double dollar bet, and the Swiss franc fund becomes a franc-vs-euro bet.
The rules themselves don't change. Once a month you still score each asset on its average 1, 3, 6, 9 and 12-month return, hold the top two if their trend is positive, keep a holding while it stays in the top three, and split the sleeve 50/50.
The EU version at a glance
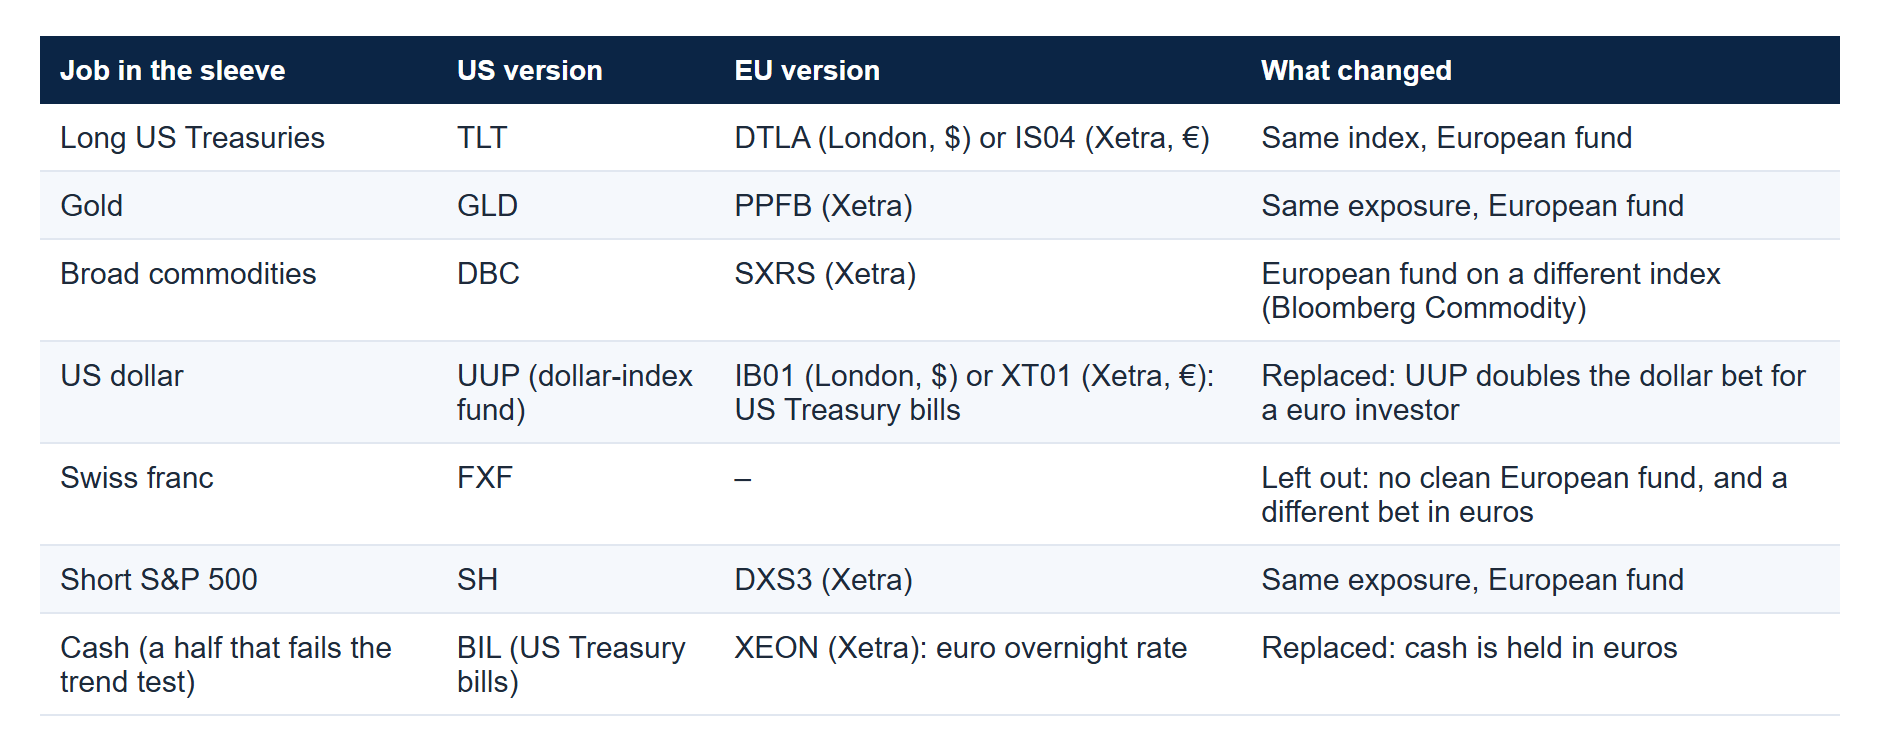 Figure 1. The EU version, fund by fund. Five hedges plus euro cash; every signal is measured in euros.
PART II — THE FOUR CHANGES, EXPLAINED
The four changes, explained
Each change either removes a currency bet nobody meant to make or replaces a fund Europeans can't buy. None of them touches the rules.
1. Signals are measured in euros
What changed: the momentum scores and trend tests use each fund's return in euros, not in dollars.
Why: in euros, every asset's trend is its dollar trend plus the dollar's move against the euro. That's the return you actually earn, so it's the one that should drive your decisions.
The effect: it changes which two assets you hold in 31% of months, mostly when the dollar is moving a lot against the euro.
2. UUP is replaced by a US Treasury bill fund
What changed: the dollar position is now a fund holding short-term US Treasury bills (IB01, or XT01 on Xetra) instead of UUP.
Why: for a euro investor, UUP counts the dollar's moves twice. If the dollar rises 10%, UUP gains about 10% in dollars, and each dollar is worth 10% more euros, so you gain about 21%, and the reverse when it falls. That's because UUP measures the dollar mostly against the euro, and you then measure UUP in euros again. Since 2007, a euro investor holding UUP saw 1.79× the euro-dollar move: a leveraged currency bet, not a calm hedge. A Treasury bill fund gives you the dollar's move once, plus US interest, for about 0.07% a year.
The effect: return and risk barely changed (+0.1 points a year). The Treasury bill fund does the job UUP was meant to do, so it works well as its replacement.
3. The Swiss franc is left out
What changed: the EU version chooses from five hedges instead of six.
Why: there's no clean substitute. No European fund gives you the franc against the dollar, as FXF does. The closest option is the franc against the euro, through franc cash (no interest) or a thinly traded currency note (about 1% a year). And that's a poor stand-in: a narrower bet driven mainly by Switzerland and the euro area, not the global flight to safety FXF captures. Its trend signal agreed with the dollar version in only 53% of months. It was also the weakest hedge in Deep Dive #3, never featuring in a major crisis.
The effect: the backtest return rose by 0.8 points a year, but that's hindsight, not the reason for the change. To keep the franc, hold it as cash and run the trend test on the franc against the euro.
4. Cash is held in euros
What changed: when a hedge fails its trend test, that half of the sleeve goes into a euro overnight-rate fund (XEON) instead of US Treasury bills (BIL).
Why: for a euro investor, US Treasury bills aren't cash. They're a dollar position, so you gain or lose whatever the dollar does against the euro.
And the timing works against you. The strategy moves to cash in calm markets after a crisis, when investors sell safe havens, the dollar included. In months when at least half the sleeve was in cash, the dollar fell about 6% a year against the euro, against a rise of about 2.5% a year otherwise (think 2003, 2009 and 2017). The slightly higher US interest couldn't make up for it: over 31 years it added +1.5 points, while the dollar's fall cost −28.
The effect: the backtest return rose by 0.8 points a year.
PART III — HOW TO RUN IT
How to run it
Five funds, bought and held, with no currency hedging. Here's what you need to know, and a backup for the one fragile fund.
The practical checklist
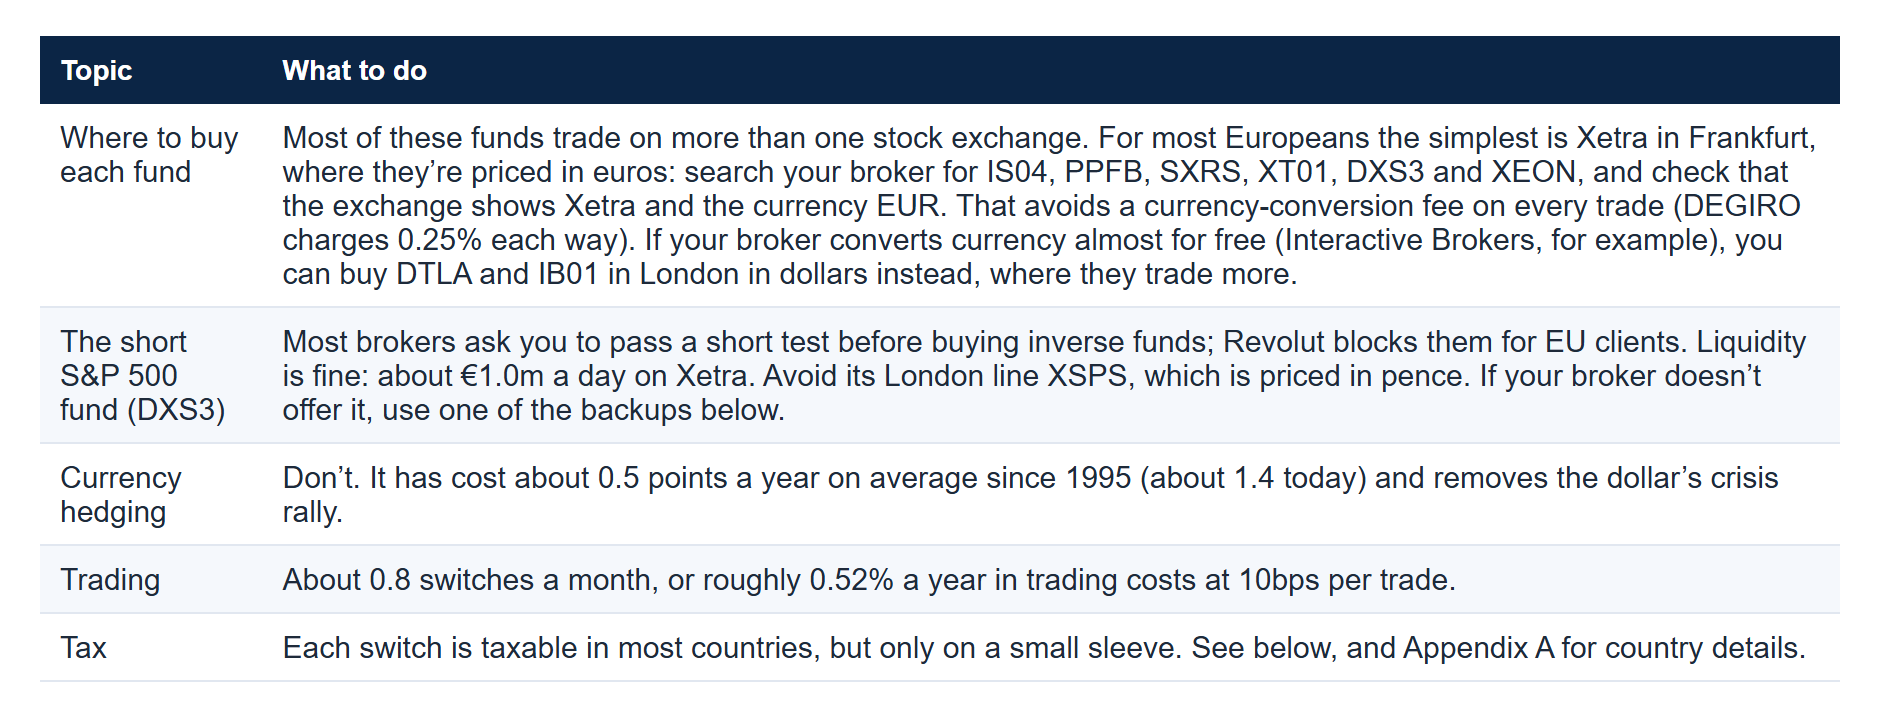 Figure 2. Running the EU version: the five things to get right.
Have a backup for the short leg
DXS3 is the only fund in Europe that goes short the S&P 500 one-for-one. It works well, but it's a single €157m fund, and Amundi has already converted its own version twice. If it closes, or your broker won't let you buy it, pick a backup now rather than in the middle of a crisis:
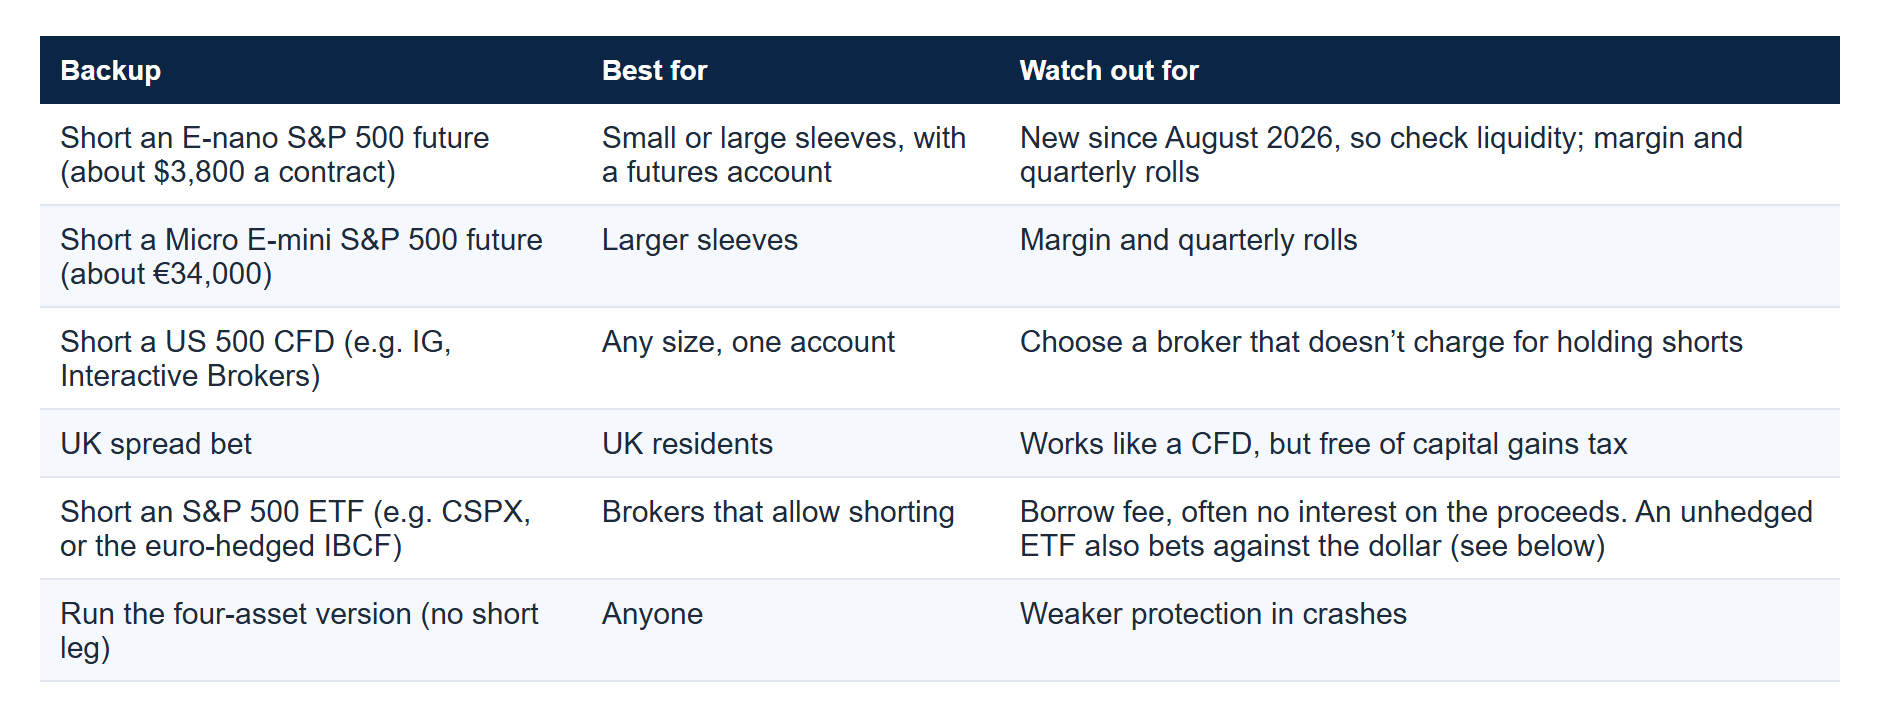 Figure 3. Backups for the short S&P 500 leg, if DXS3 closes or your broker blocks it.
One thing to know: the backups don't all behave the same when the dollar moves.
- DXS3 (the fund): you own a dollar asset, so you gain when the dollar rises.
- Futures, CFDs, spread bets or a euro-hedged ETF: almost no dollar effect.
- Shorting an unhedged ETF: you owe a dollar asset, so you gain when the dollar falls.
That matters in a crisis. In 2022, when the dollar rose 15%, the short leg made +45% through the fund, +27% through a future and +11% by shorting an unhedged ETF. When the dollar fell in early 2025, it was the other way around. Over the long run, the results were similar.
PART IV — HOW IT COMPARES WITH THE US VERSION
How it compares with the US version
The EU version holds different things from the US version about half the time, yet ends up in a similar place, whether you measure the US version in dollars, as in Deep Dive #3, or in euros. That's the reassuring part.
The headline numbers
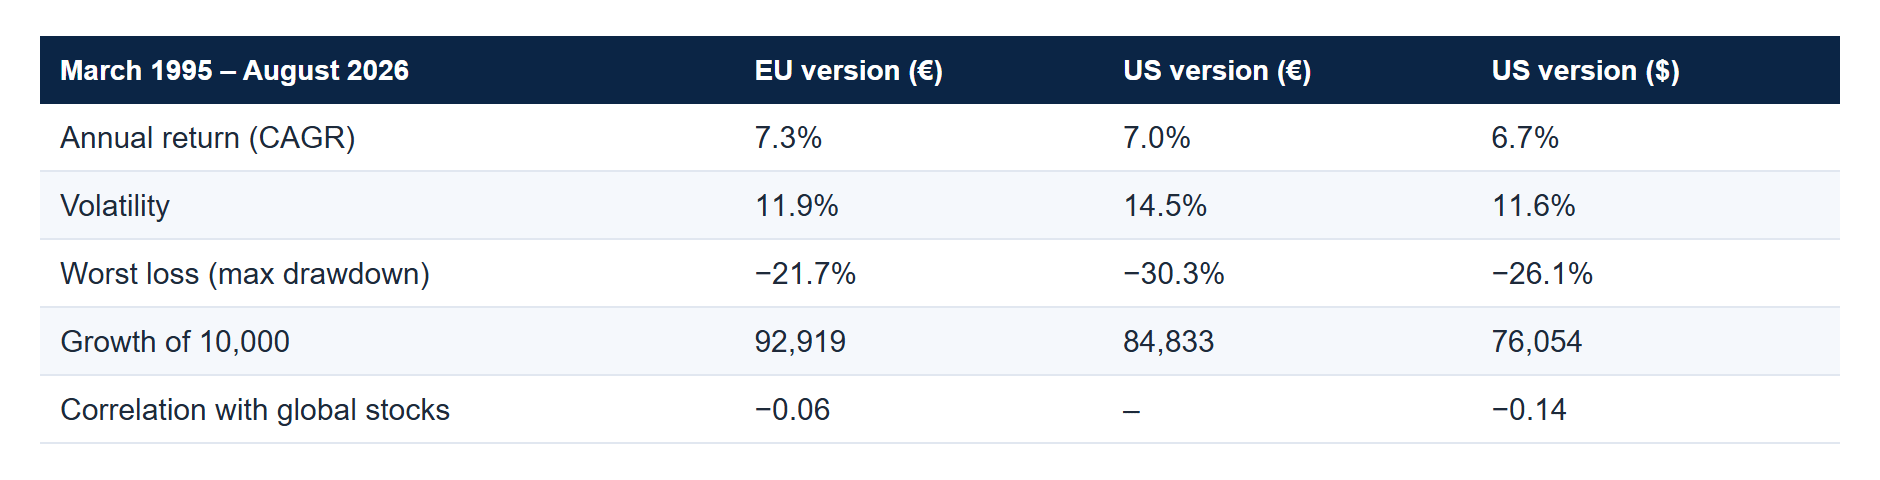 Figure 4. The EU version against the US version, measured in euros and in dollars. Source: InvestLab production engine. Monthly, net of 10bps per trade.
The bottom line: the EU version did the same job as the US version, with similar results. It returned 7.3% a year, against 6.7%–7.0% for the US version (in dollars and in euros), with a smaller worst loss, and like the US version it moved independently of stock markets. Its small lead is recent: it was slightly behind for most of the period and only moved ahead in 2025–26, so don't read it as an edge. What matters is that two different sets of funds, running the same rules, got to a similar place, which suggests the rules, not the choice of funds, are doing the work.
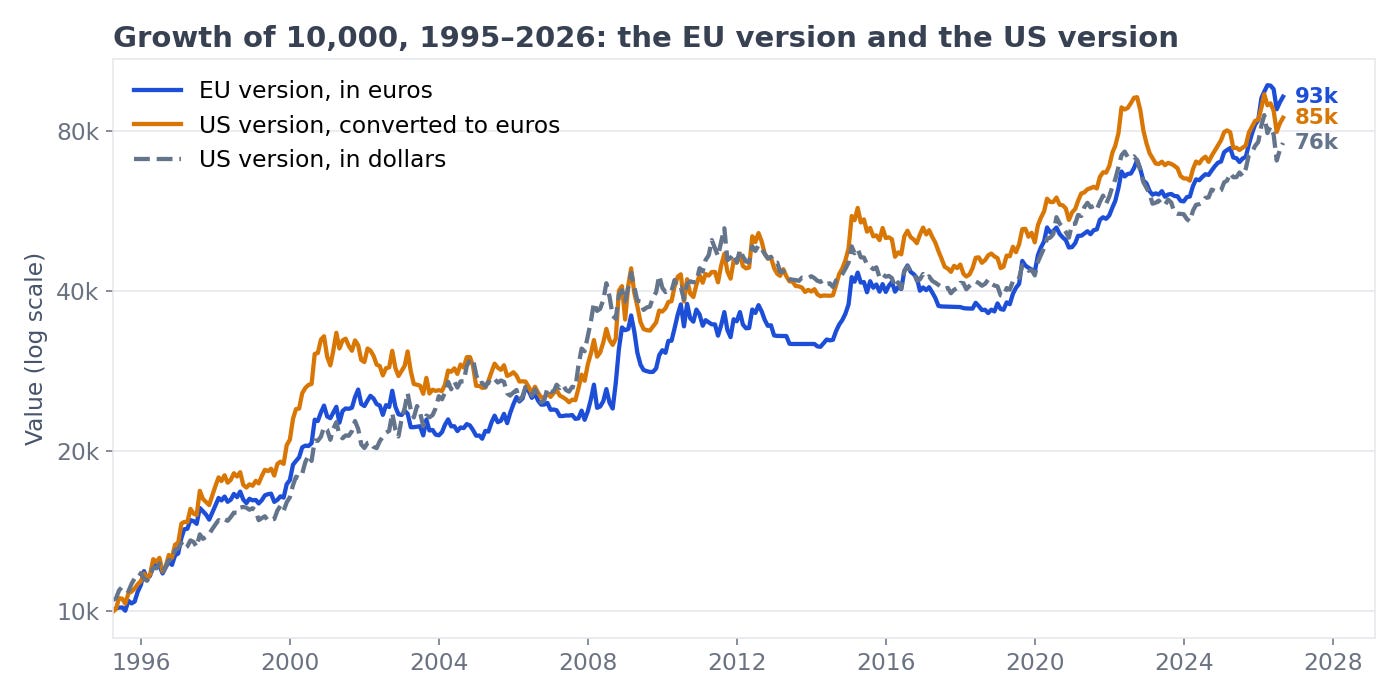 Figure 5. Growth of 10,000, 1995–2026.
Source: InvestLab production engine. Monthly, in euros unless stated, net of 10bps per trade; pre-fund history uses documented proxies translated to euros at month-end exchange rates.
Where the differences come from
Starting from the US version, we made the changes one at a time. Each row includes every change above it.
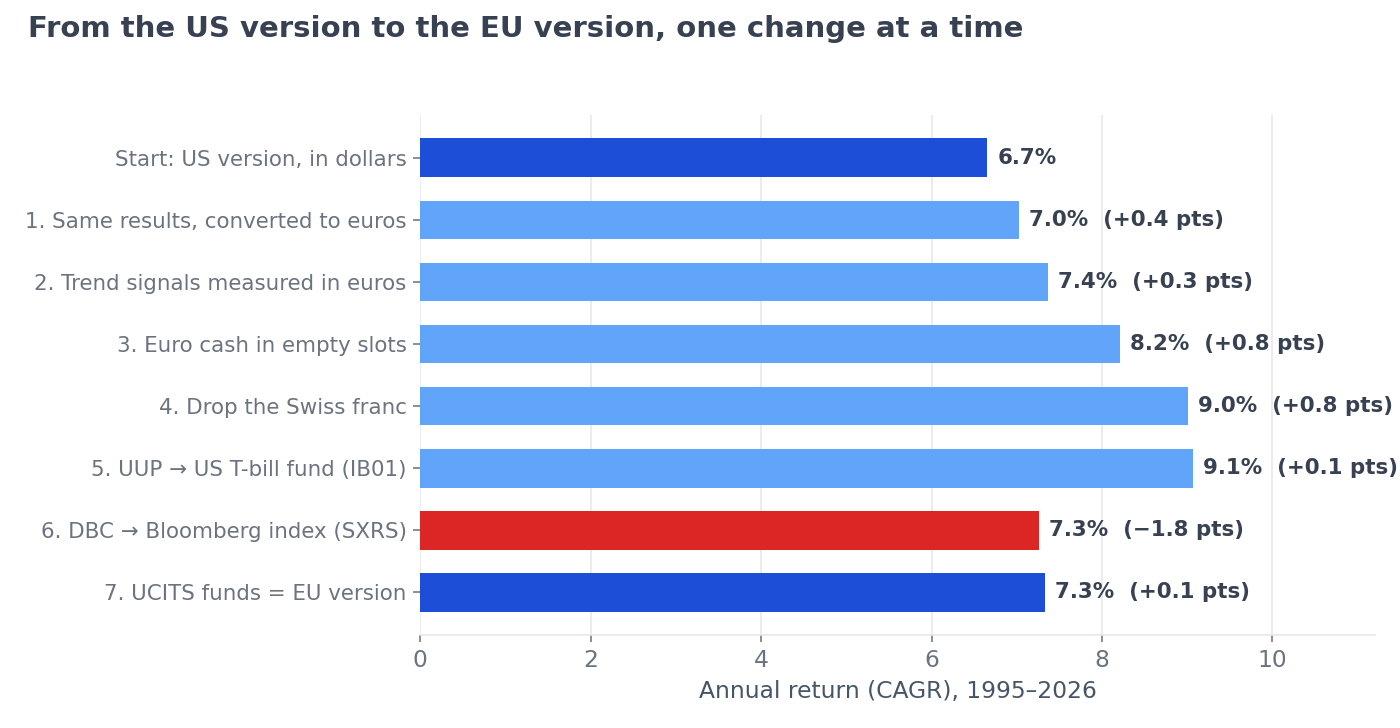 Figure 6. From the US version to the EU version, one change at a time.
Step 1 isn't a change of strategy. It's just the dollar's rise over the period, which any euro investor in the US version also got. Steps 2 to 5 take currency bets out of the sleeve and added about two points a year (7.0% to 9.1%).
Step 6 is the one real cost. No European fund tracks DBC's commodity index, and the Bloomberg Commodity index used instead cost 1.8 points a year. The two are built differently: DBC's index is about half energy, while Bloomberg caps each sector at about a third. DBC's index also picks the cheapest futures contract to roll into, up to 13 months out, while Bloomberg rolls on a fixed schedule. Both differences are permanent, so expect the gap to last.
How it did when stocks fell
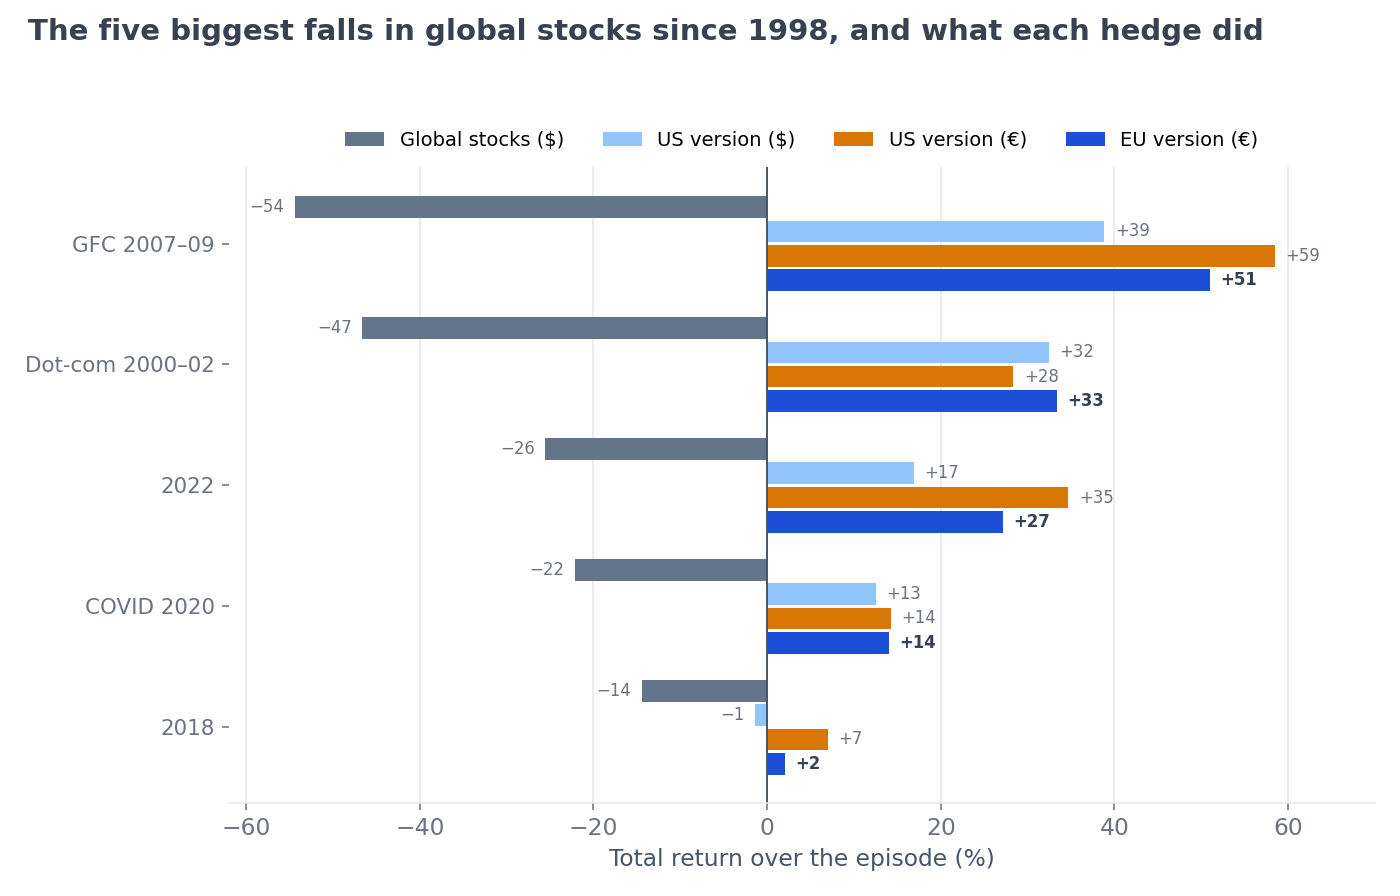 Figure 7. The five biggest falls in global stocks since 1998, biggest first, and what each version did.
Both versions made money in all four deep bear markets. Against the US version in dollars, the EU version did better in 5 of the 5, largely because the dollar rose against the euro (+14% in the GFC, +15% in 2022) and the EU version kept that gain. Against the US version in euros, the picture is mixed. UUP's double dollar bet paid off in the GFC, 2018 and 2022, while the EU version did better in the dot-com bust. The same double bet hurt when the dollar fell: in early 2025, a fall only euro investors felt, the US version in euros lost 7% against 2% for the EU version.
Why its losses were smaller
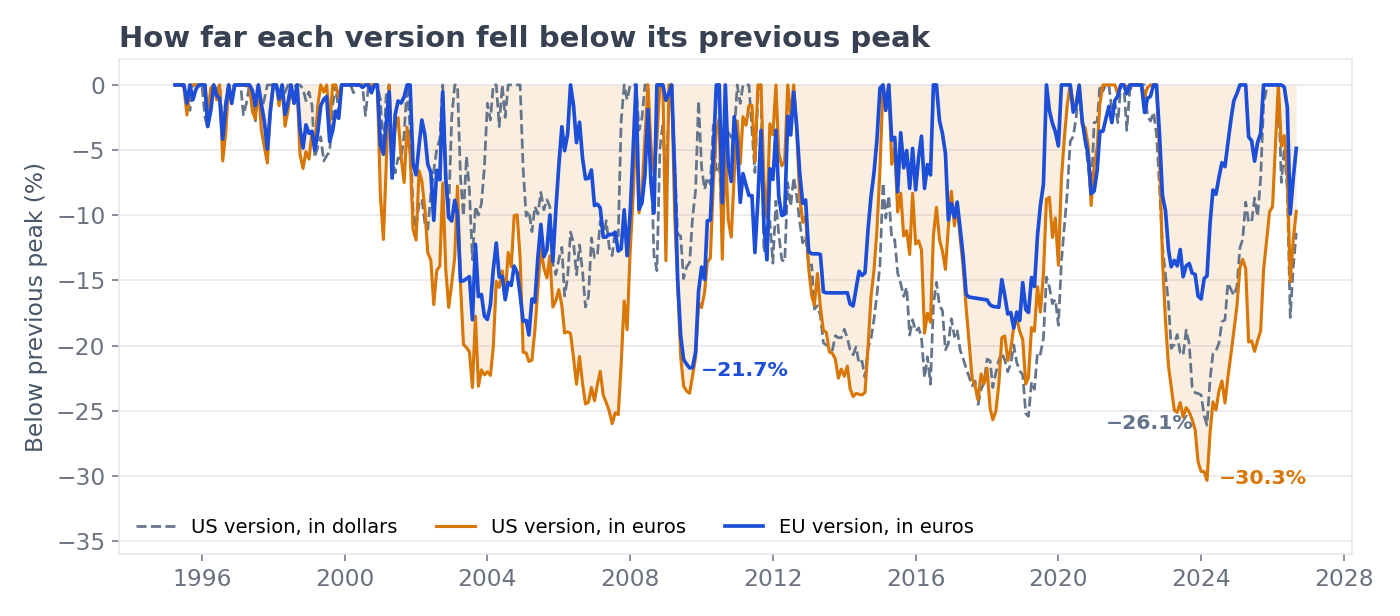 Figure 8. How far each version fell below its previous peak, 1995–2026: the US version in dollars and in euros, and the EU version in euros. The EU version's drawdowns were usually shallower, but not always.
The EU version's worst loss (−22%) was smaller than the US version's, whether you measure the US version in dollars (−26%) or in euros (−30%). The main reason is the dollar: with euro cash and a single rather than double dollar position, the EU version is less exposed when the dollar falls against the euro, which is what caused the US version's biggest losses for euro investors. It isn't always ahead, though. In some stretches, such as 2010–14, it fell further because it held different assets.
Why the holdings differ, and why that's fine
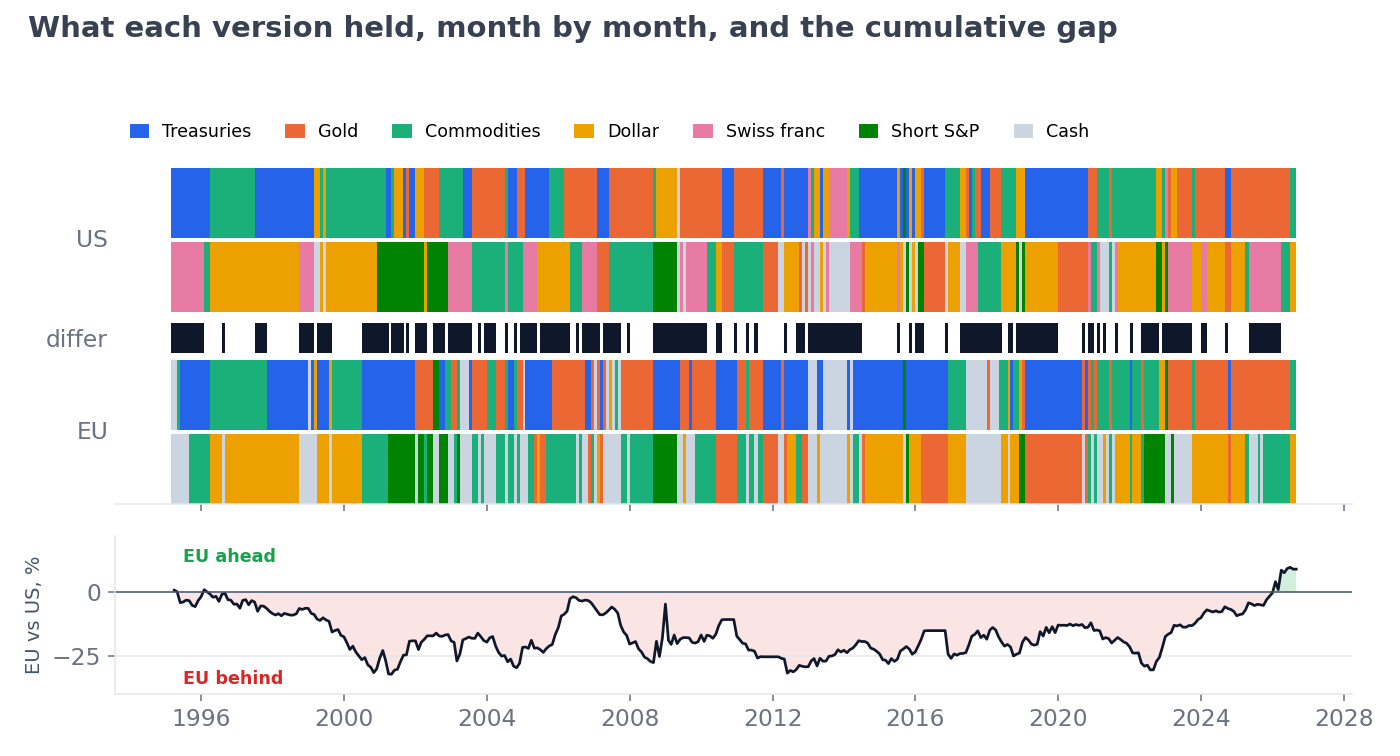 Figure 9. What each version held, month by month, and the cumulative gap. Top: the two holdings of each version; black marks months when they differ. Bottom: the cumulative return gap since 1995, EU minus US, both in euros.
The two versions held the same pair of assets in 44% of months. That sounds low, but it's normal for this kind of strategy:
- The ranking often comes down to near-ties. Change even one rule of the US version, such as the lookback periods, and it holds a different pair in 11–39% of months. The EU version changes several things at once.
- They rarely disagree completely. They shared at least one holding in 89% of months.
- The funds themselves match. Since 2019, each European fund has moved almost in lockstep with its US twin (correlations of 0.89 to 0.98), and their trend signals agreed in 90–100% of months.
Different holdings, the same kind of protection. The chart below splits each version's gains in the four deep bear markets by asset. For the two versions measured in euros, the dollar's move against the euro is shown separately (hatched).
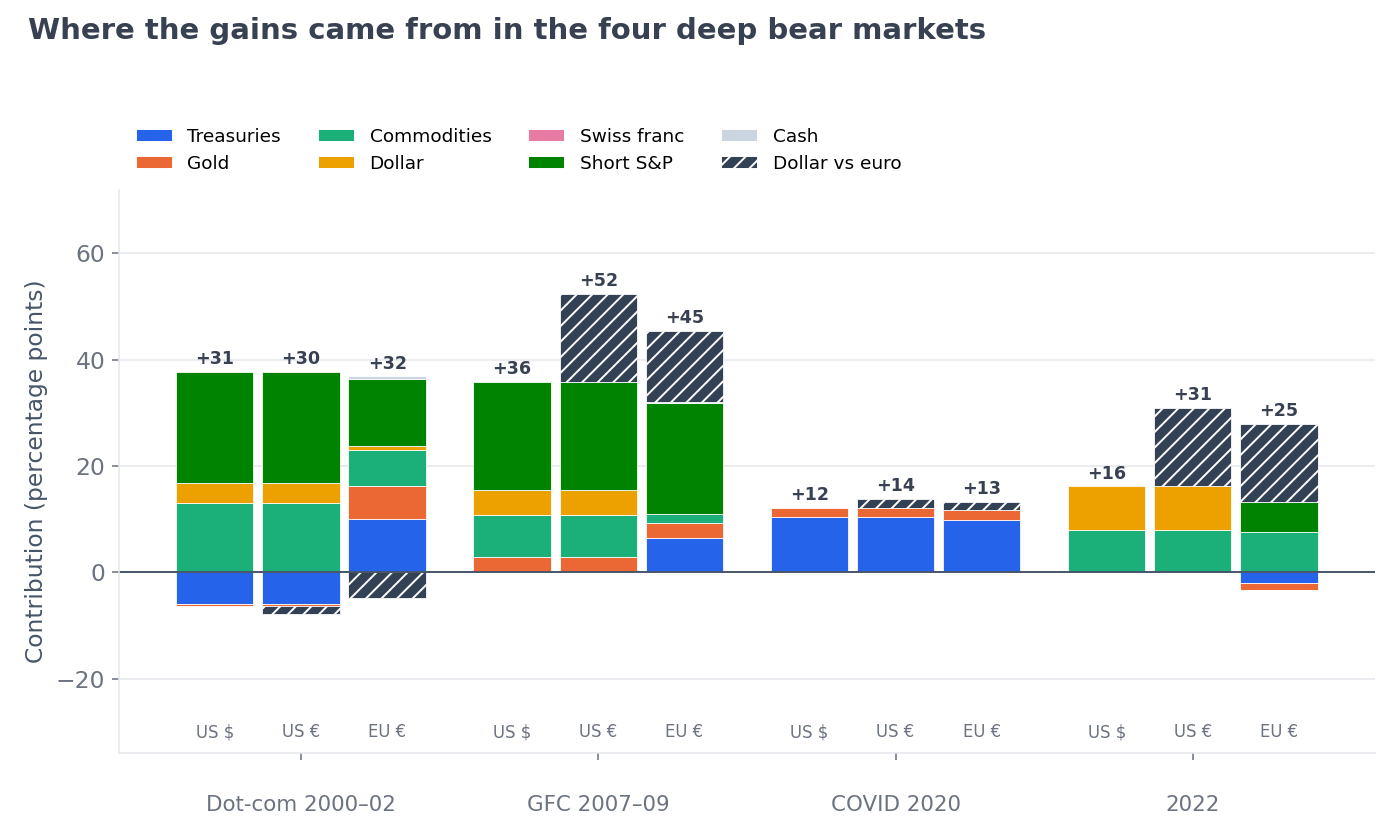 Figure 10. Where the gains came from in the four deep bear markets: the US version in dollars and in euros, and the EU version in euros.
The same hedges did most of the work in all three: the short S&P 500 in the dot-com bust and the GFC, Treasuries in COVID, and commodities in 2022. The EU version leaned more on Treasuries and gold, where the US version held UUP. And in the GFC and 2022, the dollar's rise against the euro added a big slice for both euro-measured versions. In the US version it came on top of UUP's own dollar gain, which is the double bet from Part II.
What it does mean is a different ride. In a typical year, expect the two versions' returns to differ by about 6.4% to 8.1%.
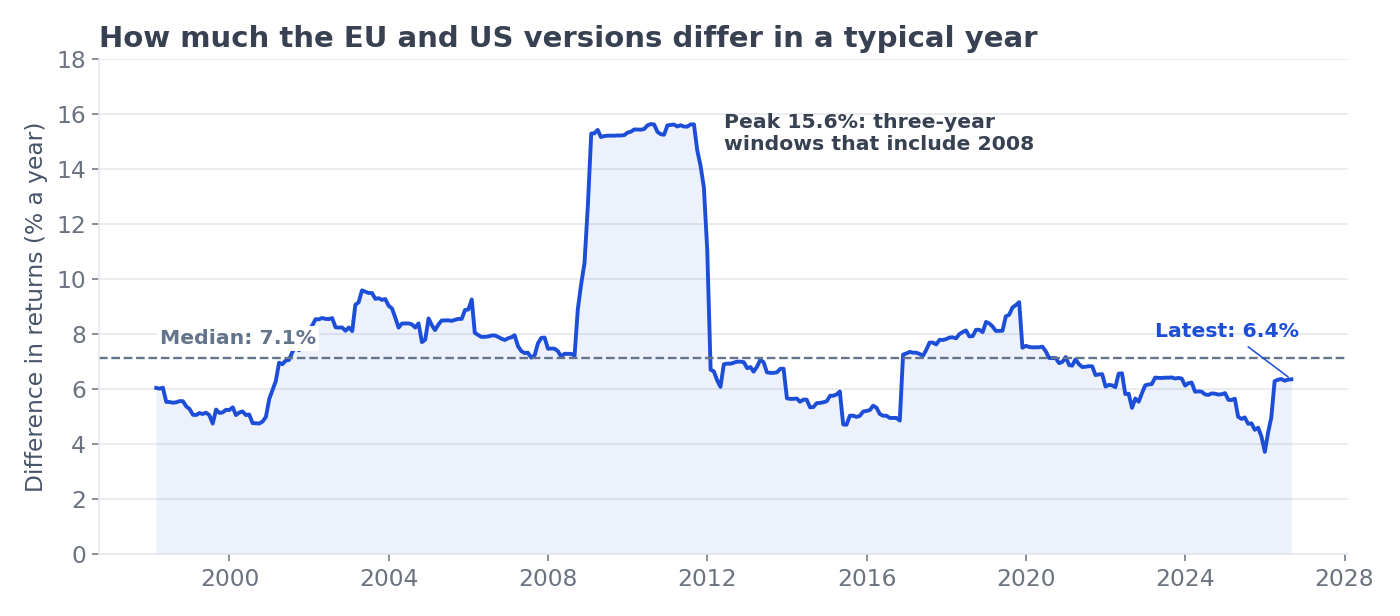 Figure 11. How much the EU and US versions differ in a typical year.
A close call in mid-2005 is a good example: in dollars the dollar fund ranked ahead of gold, in euros gold ranked ahead. Gold then rose 43% in euros, and over the next ten months the EU version made +13% while the US version made −7%. Other near-ties went the other way.
PART V — WHAT TO BE CAREFUL ABOUT
What to be careful about
The risks specific to the EU version
Everything in Deep Dive #3's risk section still applies: the strategy needs persistent trends, it can hold the wrong hedge, it's slow, and it can lag for years. The EU version adds a few of its own.
- The biggest risk: a crisis in which the dollar falls. On average 83% of the sleeve is in funds priced in dollars. In the GFC and 2022 the dollar rose against the euro and added about 14–15 points to the EU version. But it rose in only 35% of the 40 worst months for global stocks. If the next big crisis is centred on the US and the dollar falls, that boost becomes a drag and the sleeve would protect noticeably less. Early 2025 was a small taste: stocks fell 13% in euros, the dollar fell 9%, and the EU version lost 2%. The euro signals help only slowly, moving more of the sleeve into euro cash as the dollar's slide shows up in the trends. Gold, which has tended to rise when the dollar falls, is the hedge most likely to still help.
- Expect lower returns than the backtest. The same warning as in Deep Dive #3 applies: much of the return came from long trends in gold and commodities that may not repeat, so plan on lower returns, with the protection doing most of the work. The EU version adds two more reasons: the dollar's net rise against the euro added about 1.0 point a year to the backtest, and the commodity index and euro cash are small built-in drags. In calm years it earns little: from 2010 to 2018 it made 2.3% a year.
- The short leg is a single fund. Have your backup from Part III written down.
- The early history is reconstructed. Before each fund existed, its history comes from documented proxies, and before 1999 the euro is represented by its predecessor, the ECU. Treat 1995–2018 as evidence of how the exposures behaved, not as returns you could have earned.
- Don't flip between versions. Some months the US signal will look smarter. Switching to whichever looks better is chasing performance. Pick the version that matches your currency and stick with it.
PART VI — IS IT RIGHT FOR YOU?
Is it right for you?
The fit test and the verdict
Deep Dive #3's fit test still applies: Adaptive Hedge suits investors who want to keep a large allocation to stocks, worry mainly about deep and lasting bear markets rather than corrections, and can live with a hedge that sometimes looks wrong for years. If you're in Europe, ask yourself four more questions:
- Are you comfortable holding dollar-priced funds without hedging? That has usually helped in crises, but not in one where the dollar falls.
- Can you buy the short S&P 500 fund? If not, choose your backup from Part III now.
- Where will you hold it? In a UK ISA or SIPP it's simple. Elsewhere, expect some tax in the good years.
- Can you ignore the US version? The holdings will differ about half the time.
My verdict: it's a sound way to run the strategy in euros, with realistic expectations. I'm confident in the mechanism: defensive assets have tended to trend during slow bear markets, and the European funds track their US twins closely. The EU version made money in every deep bear market since 1995 and landed close to the US version over three decades. I'm less confident in the size of future returns, so plan for less than the backtest's 7.3% a year. The main open risk is a crisis in which the dollar falls.
Before you start, write down why you're using it:
I'm using this strategy for lower-cost protection against deep, lasting bear markets, while my equity core stays intact. I run it in euros, with European funds, and I accept that most of them are priced in dollars. It may miss corrections, react slowly to fast crashes, fall 20–30% on its own, lag for years and look worse than the US version in some years. I will judge it on its own euro record, over full market cycles.
Getting started
All you need is a spreadsheet and about 15 minutes a month: the rules are in Deep Dive #3 and the funds are in Part I of this paper. But don't just read about it. Test it in euros, see how you react when it looks wrong, and write down your backup for the short leg before you need it.
The portfolio today
The strategy rebalances at the end of each month. Rather than freeze one month's positions into this article, here is the live EU strategy — current holdings, performance and trade history, always up to date, in euros:
Important information — please read. This guide is published by InvestLab for educational and informational purposes only and does not constitute investment advice, a personal recommendation, regulated advice, investment management, or an offer or solicitation to buy or sell any financial instrument. InvestLab is not authorised or regulated by the Financial Conduct Authority, the Comisión Nacional del Mercado de Valores, or any other financial regulator, and reading this guide, subscribing, or corresponding with the author does not create an adviser-client or fiduciary relationship. Any tickers named (including DTLA, IS04, PPFB, SXRS, IB01, XT01, DXS3 and XEON, and the US funds TLT, GLD, DBC, UUP, FXF, SH and BIL they replace) are referenced solely to illustrate the mechanics of the strategy. The strategy is presented as a systematic portfolio construction case study and may not be suitable for your objectives, financial situation, tax position, risk tolerance or jurisdiction. All backtested performance is hypothetical, produced with hindsight, and subject to material limitations, including proxy data where today's funds did not exist (and, before 1999, the ECU standing in for the euro), estimated costs (10 basis points per trade), liquidity assumptions, taxes, slippage, currency translation at month-end exchange rates, and the risk that live results fall short of historical results. Past performance, whether actual or hypothetical, is not a reliable indicator of future returns. The strategy can lose money, may fail to protect in a given crisis, holds mostly dollar-priced funds without currency hedging, uses an inverse ETF whose daily reset can cause decay, and could suffer losses larger than those shown historically. The author may invest in this strategy or related instruments, and InvestLab is a commercial product, so conflicts of interest may exist. Nothing here is tax advice, and you should consult an authorised financial adviser and/or tax professional before acting. You alone are responsible for your investment decisions, and InvestLab and its author accept no liability for losses arising from the use of this material.
For information and education only — nothing here is investment advice. Backtested and live results are shown with their assumptions; past performance does not guarantee future returns.