Adaptive Hedge: A Cheaper Way to Survive the Next Bear Market
By Stephane Renevier
PART I — MEET THE STRATEGY
Why you might want an adaptive hedging strategy
In 2008, long-term Treasuries gained 34% while global stocks were cut roughly in half. In 2022, that same “safe” asset lost 31% - more than the stock market it was supposed to protect.
That is the problem: there is no single hedge you can rely on across every crisis. Recessions can favour bonds, inflation shocks commodities, and financial stress the dollar or gold. The asset that protects you brilliantly in one regime can do almost nothing - or make things worse - in the next.
There are three broad ways to deal with that. You can permanently own a mix of assets designed to perform in different environments, as we do in our Lean All-Weather and Balanced portfolios. You can tactically rotate the whole portfolio, as in Dual Momentum Pivot5. Or, if you want to keep a simple equity core, you can leave the stocks alone and adapt the hedge around them.
That is what Adaptive Hedge is designed to do: rather than owning every possible hedge all the time, it tries to own the ones currently being rewarded by the prevailing regime.
How it’s built
The design starts with the realities of a retail portfolio. It needs to be simple enough to run in about 15 minutes once a month, use liquid ETFs, avoid leverage and derivatives, and keep the actual number of trades low. Those constraints rule out much of the professional tail-hedging toolkit, as well as some more elegant institutional approaches to portfolio construction. So the aim is not theoretical perfection - it is the best version that is practical for a retail investor to run.
To cover the main types of crisis without making the strategy unwieldy, we use six potential hedges. There is inevitably some hindsight in that choice - we know how different assets behaved in past crises - but the universe is built around distinct economic roles rather than simply picking the assets with the best backtests.
The approach was inspired by Thomas Carlson’s paper Defense First: A Multi-Asset Tactical Model for Adaptive Downside Protection (2025).
Each plays a different role. Long Treasuries tend to work best when growth collapses and inflation falls. Commodities are almost the mirror image: they can help when inflation surprises on the upside, as in 2022. Gold has historically been useful during periods of monetary stress and falling confidence in financial assets.
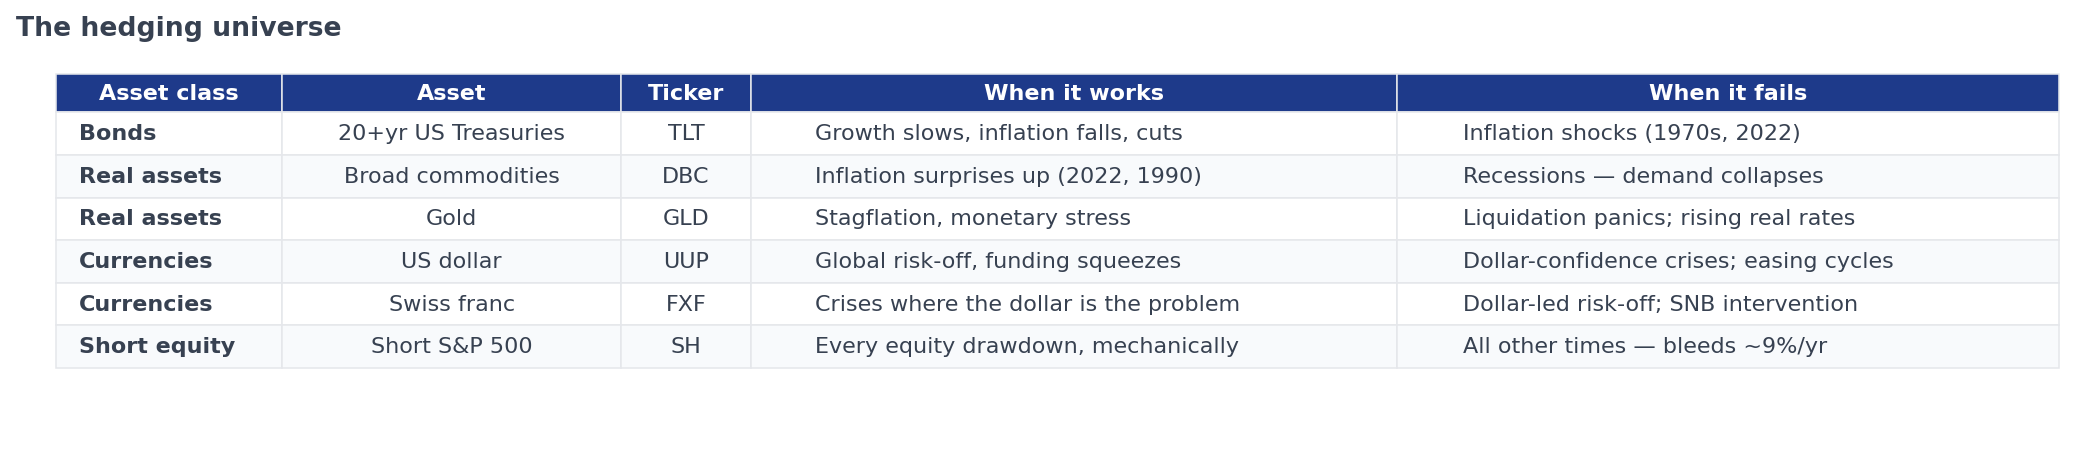 Figure 1. The six hedges and when they work. Each candidate protects against a different kind of shock.
The two currencies are there for different reasons too. The US dollar is the broader risk-off hedge, often benefiting when investors and borrowers scramble for liquidity. The Swiss franc is more specific: it can help during monetary stress, including scenarios where the dollar itself is under pressure.
Finally, there is short equities - the only hedge in the universe whose relationship with stocks is mechanical rather than regime-dependent. If stocks fall, the short will rise. The drawback is equally direct: holding that protection permanently is expensive.
Testing the hedge universe
Before adding any timing rule, we first need to know whether the underlying assets are actually useful hedges. So we look at how each one performed through the ten worst drawdowns in global stocks since 1985, measured from the market peak to the bottom.
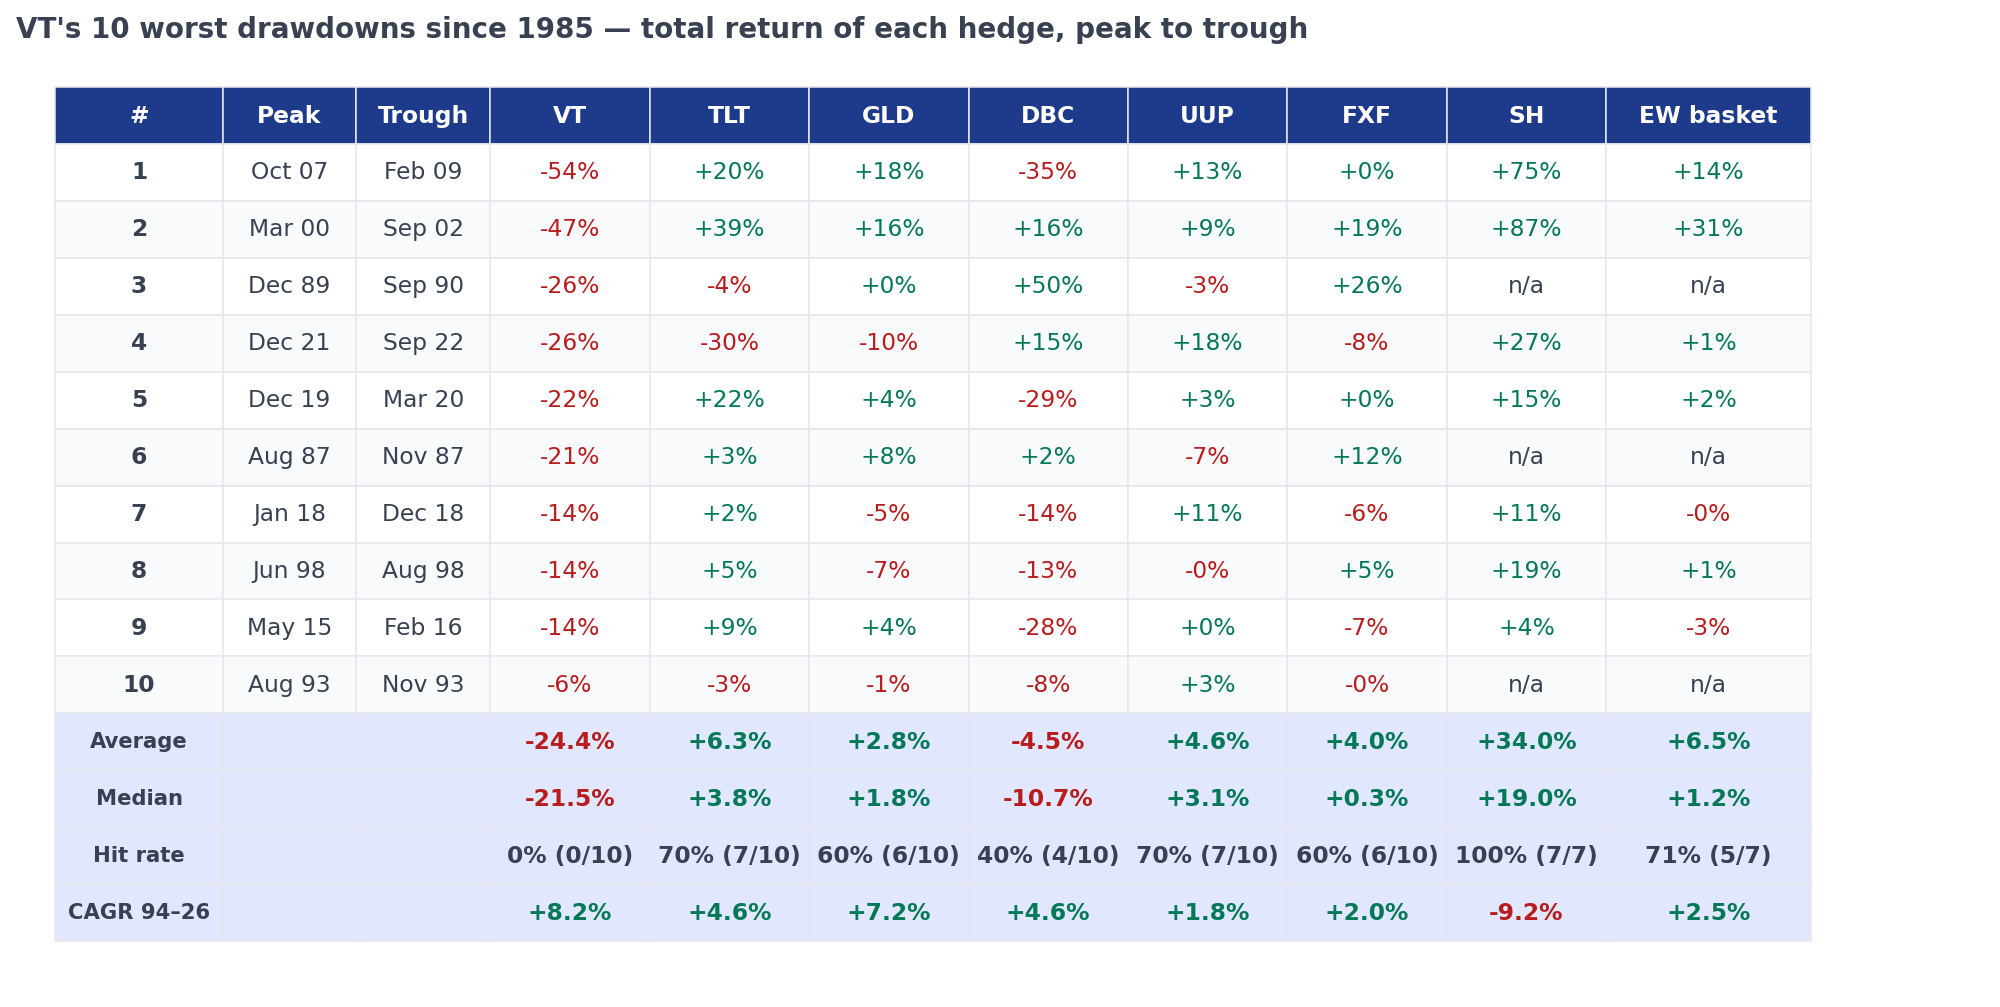 Figure 2. How each hedge performed in the ten worst global-equity drawdowns since 1985 (peak-to-trough total returns).
Note: A methodological caveat matters here. Several ETFs did not exist for the full period, so earlier histories use investable market proxies spliced to the ETF series. These figures therefore show how the underlying exposures behaved historically, not returns an investor could literally have earned from those ETFs before their launch.
Three things stand out.
First, there is no universal hedge. The GFC rewarded short equities, Treasuries and the dollar; 2022 rewarded commodities and the dollar; other crises produced different winners. The core problem is exactly what motivated the strategy in the first place: the best hedge depends on the shock.
Second, the universe is already fairly defensive even without timing. An equal-weight basket returned about 14% in the GFC, 31% through the dot-com bust and roughly flat in 2022. Across the full history it compounded at around 2.5% a year, roughly in line with cash. Removing the costly short-equity position improves the long-run return, but makes the protection less dependable in big stock-market falls.
Third, most of these hedges are not permanently expensive to hold. Treasuries, gold, commodities and both currencies produced positive nominal returns over our sample. That does not mean they should earn attractive returns in future - particularly gold, commodities and currencies, where the long-run expected return is debatable - but it does mean the strategy is not starting from a portfolio where every hedge is structurally expensive to own.
So the starting point is promising: different assets protect against different shocks, and most are not especially costly to hold. The next step is to see whether momentum can improve on simply owning them all.
The rules
The strategy is deliberately simple: five steps, once a month, in about 15 minutes. The goal is to react to meaningful changes in leadership without turning the hedge into a trading machine.
Step 1 — Score each asset
For each of the six assets, calculate its return over the past 1, 3, 6, 9 and 12 months, then take the average. That gives us a momentum score.
Using several lookback periods makes the signal less dependent on any single parameter: shorter horizons react faster when regimes change, while longer ones help filter out noise.
Step 2 — Pick the top two (using relative momentum)
Rank the six hedges by their momentum scores and select the top two.
This is the relative momentum part: we are asking which hedges are performing best right now.
Holding two keeps the strategy simple for retail investors, concentrated enough to matter, but diversified enough not to depend on a single asset.
Step 3 — Make sure they are actually trending up (using absolute momentum)
Being the best of a bad bunch is not enough.
For each of the top two assets, we check its five lookback returns. If at least three are positive, the trend passes and we hold it. If not, that 50% allocation goes to cash instead.
This is the absolute momentum filter. It prevents the strategy from buying an asset simply because it is falling less than everything else.
Step 4 — Don’t sell what you hold just because it slipped one place
Here’s a problem with a strict top-two rule: the assets ranked second and third swap places constantly on small differences, and every swap is two trades. So we add a holding rule: An asset you already own keeps its place as long as it still ranks in the top three and still passes the trend test. A new asset can only get in by ranking in the top two.
Think of it as: strict on entry, patient on rank, ruthless on trend. The rule never overrides Step 3: if a holding’s trend breaks, it is sold whatever its rank. But it stops the strategy from churning between near-equivalent assets. It’s not perfect - it’s path-dependent and has a small knife-edge issue - but it’s effective: in our tests, it roughly halved trading, extended the average holding period to over six months, and left the crash protection essentially unchanged.
Step 5 — Split the sleeve equally
Each qualifying hedge gets 50%. If one fails the trend test, half the portfolio sits in T-bills. If both fail, the strategy moves entirely to cash.
Equal weights are deliberate. They keep the strategy simple, transparent and harder to overfit. More sophisticated sizing can improve some historical results, but every extra parameter also creates another opportunity to fit the past.
An illustrative example: the September 2026 signal
At the end of August, the strategy was already holding commodities (DBC) and the US dollar (UUP). The new ranking put DBC first, gold second and UUP third:
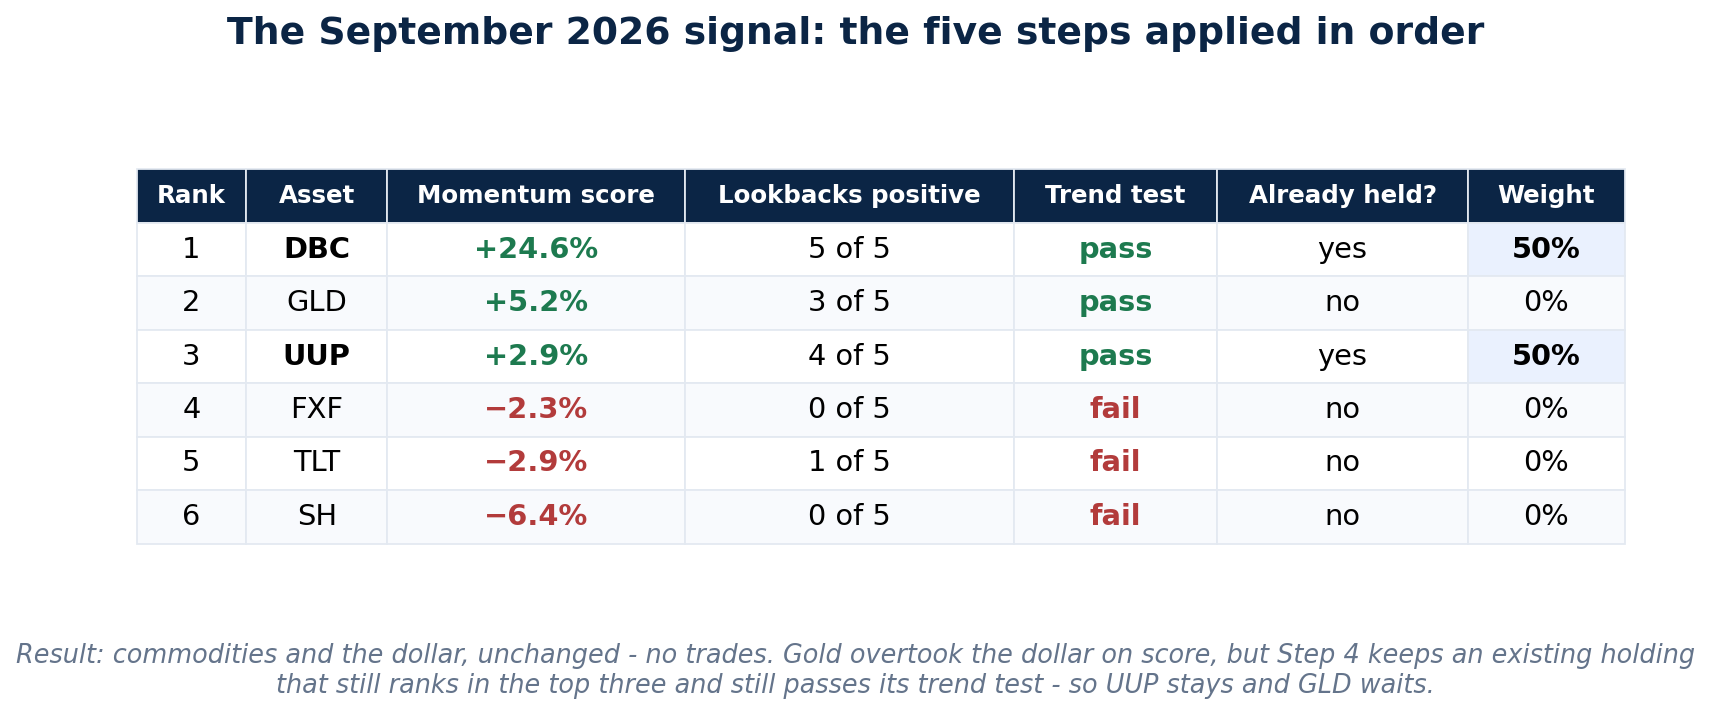 Figure 3. The actual end-of-August 2026 ranking deciding September’s holdings.
A strict top-two rule would have sold the dollar and bought gold. But UUP was already held, still ranked in the top three and still passed its trend test, so the buffer kept it in place.
So the September portfolio stays 50% DBC and 50% UUP, with no trades. Gold’s strong August was enough to move into second place, but not enough to dislodge an incumbent that is still doing its job. The point of the holding rule is not to predict which asset will win next - it is to avoid trading on small ranking changes until there is stronger evidence that the current holding has weakened.
PART II — ASSESSING THE PROTECTION
Assessing the protection
A hedging strategy should be judged differently from a normal investment strategy. The question is not whether it beats stocks over time. It is whether it protects when stocks are falling badly, and what that protection costs.
Every hedge trades off cost, reliability and speed. For instance, put options are reactive and dependable, but expensive. Adaptive Hedge makes the opposite trade: it aims to be much cheaper to carry, while accepting slower and less reliable protection. So the first test is simple: when stocks really fell, did it actually help?
The headline result
Since 1995, global stocks have suffered seven drawdowns of more than 10%. The Adaptive Hedge made money in the four deepest ones, including roughly +32% during the dot-com bust and +39% during the Global Financial Crisis, while global stocks lost close to half their value. It also gained during COVID and the 2022 bear market.
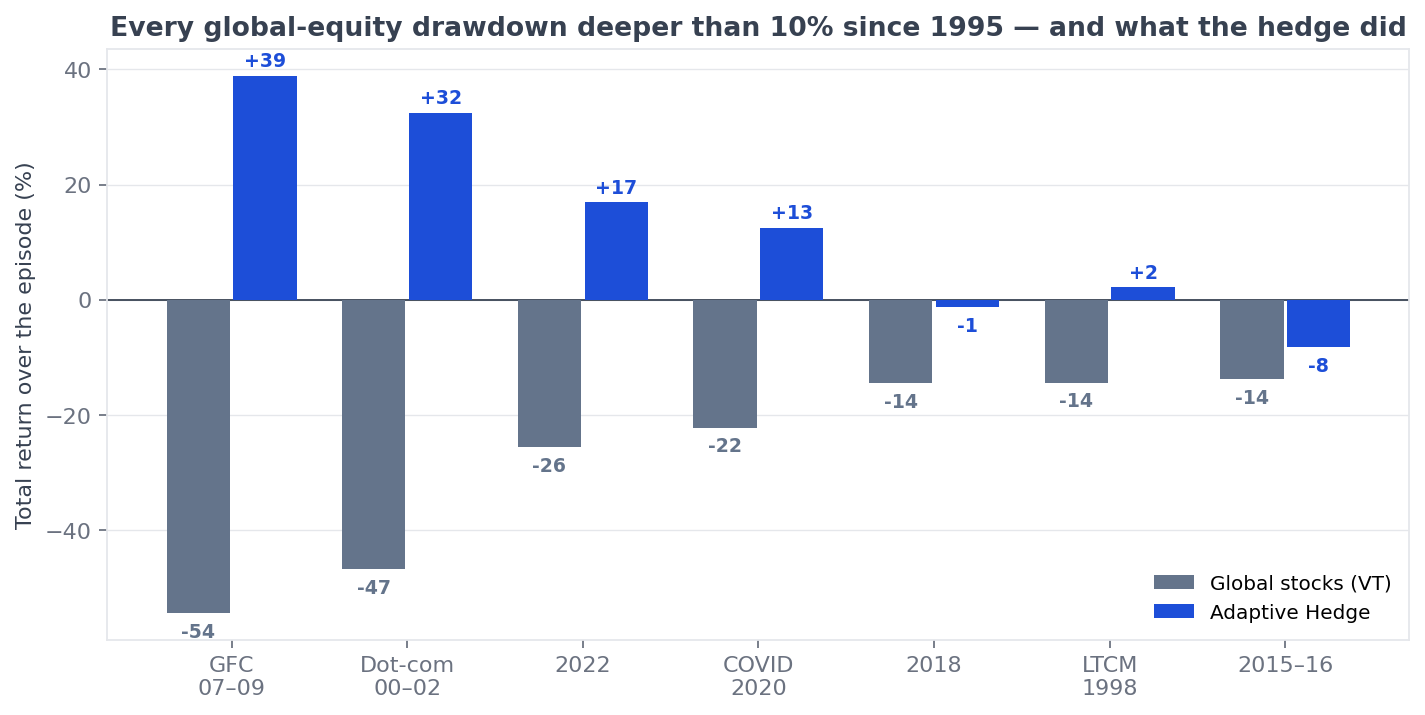 Figure 4. Every global-equity drawdown deeper than 10% since 1995 - global stocks (grey) versus the strategy (blue) over the same peak-to-trough window.
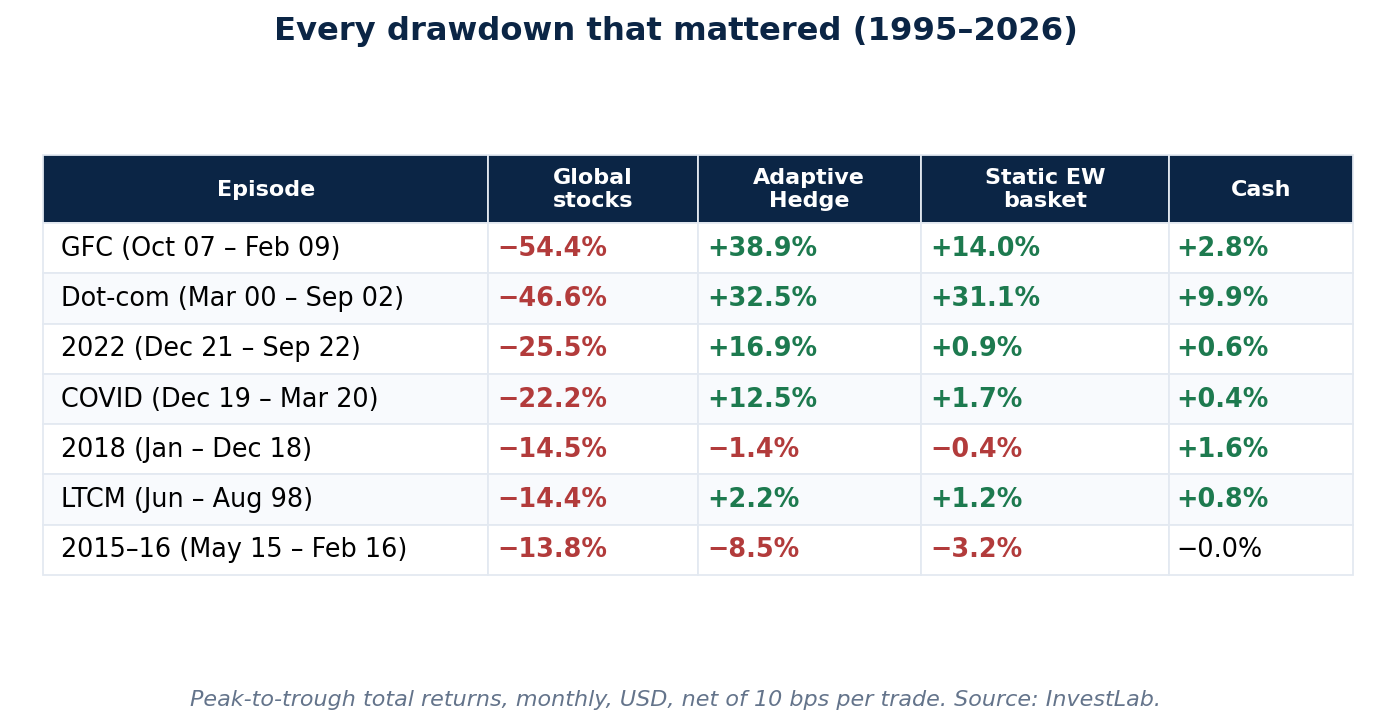 Figure 5. Every drawdown that mattered. Peak-to-trough returns for global stocks, the strategy, a static equal-weight basket of the six hedges, and cash, in each global-equity drawdown deeper than 10% since 1995.
But the pattern matters more than the headline. The strategy was strongest in deep, sustained bear markets and much less reliable in smaller corrections, losing money in both 2015-16 and 2018.
That tells us how to think about it: this is bear-market protection, not correction protection. If you want every 10-15% wobble cushioned, owning less equity or put options is more reliable.
If we zoom in on each crisis, we notice two interesting features.
First, the strategy has often been positioned before the crash. It does not predict the selloff itself. Instead, it reacts to trends already developing in defensive assets - and those trends have often started before equities peaked. So the strategy can get defensive early, not because it forecast the crash, but because it responded to the forces building underneath it.
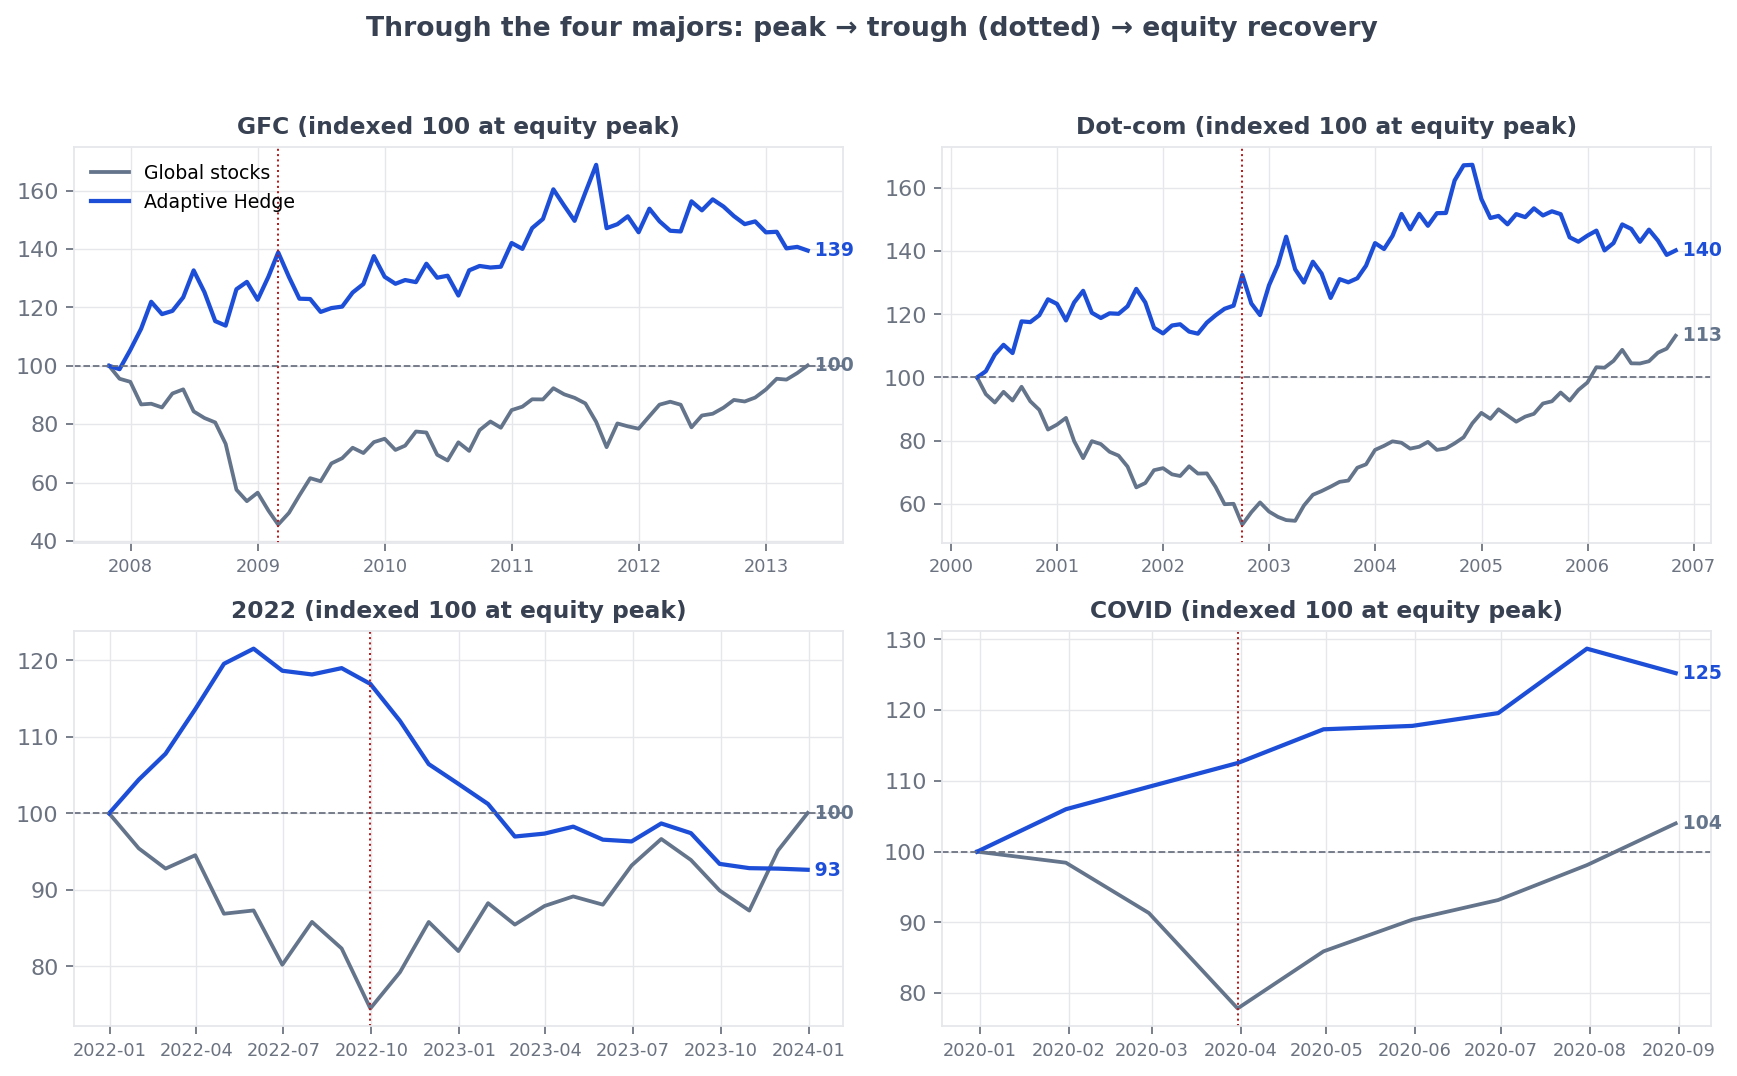 Figure 6. Through the four majors: twelve months before the equity peak (shaded) to twelve months after the trough, both lines indexed to 100 at the peak, identical axes on every panel. The strategy was already rising into every peak, and after three of the four troughs it kept climbing rather than giving the gains back - 2022 is the exception.
Second, it has often avoided giving those gains straight back once stocks recovered. A put or permanent short typically starts losing value as markets rebound. Adaptive Hedge has tended to keep rising instead, as gold, commodities and other assets benefited from the policy response and the next macro regime. That happened after the dot-com bust, the GFC and COVID, though not after 2022, when tightening produced no comparable trend.
Different crises, different contributors
The headline returns tell us the strategy protected in several major bears. More interesting is what actually drove those gains.
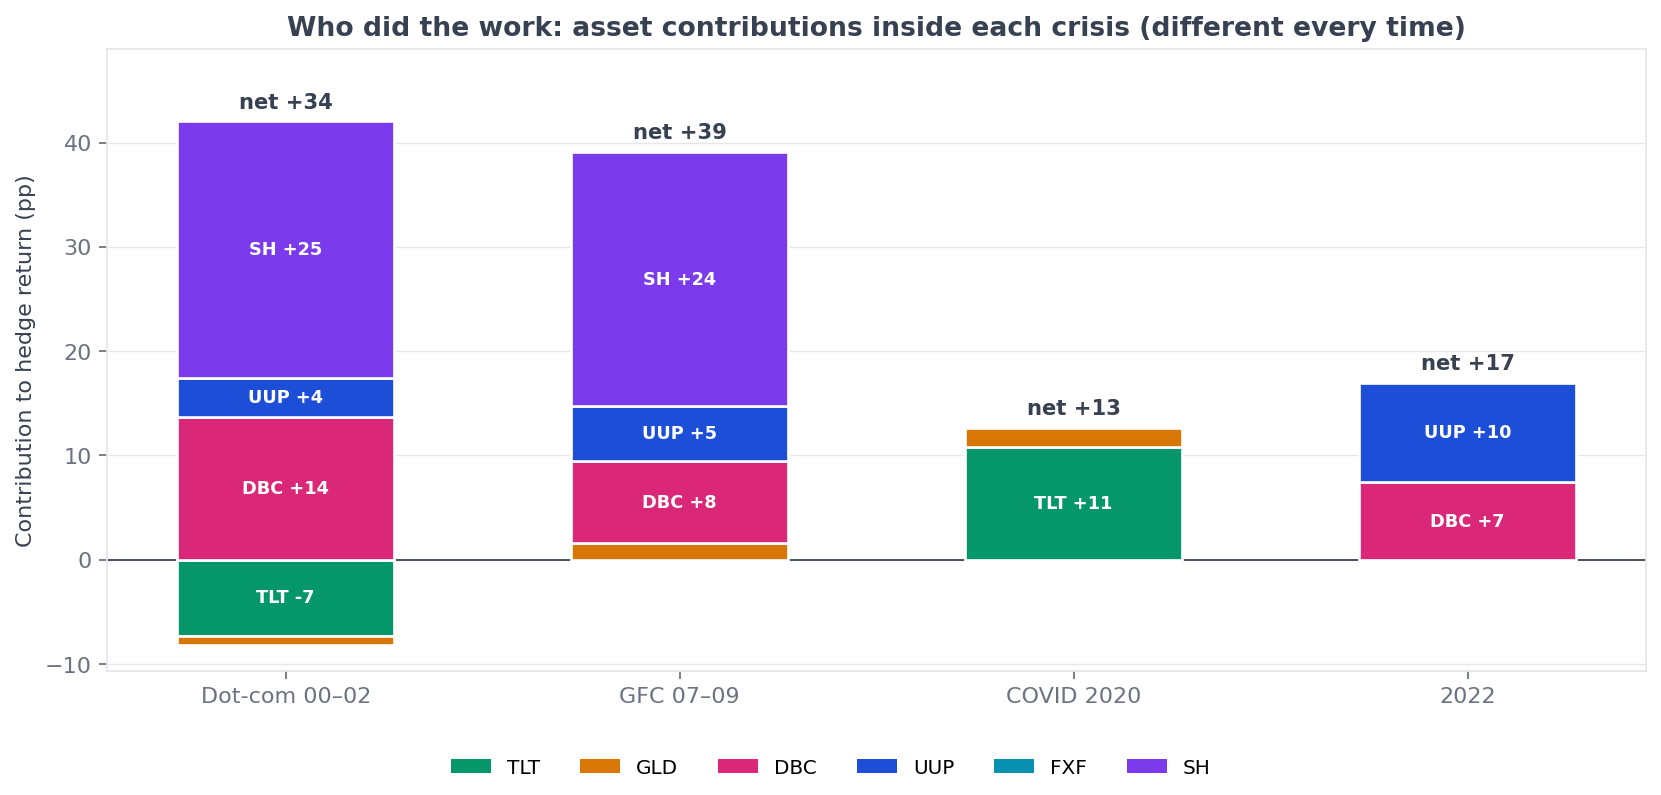 Figure 7. Who did the work: contribution to the strategy’s return by asset, inside each of the four bears.
There was no single hero. The dot-com bust was initially hedged by commodities and the dollar before the portfolio rotated toward gold and short equities. During the GFC, gold and commodities did much of the early work before short equities and the dollar took over. In 2022, commodities and the dollar were already benefiting from the same inflation shock hurting stocks. COVID was different again: the crash happened too quickly for a monthly signal to react, but the strategy entered it already holding bonds and gold. The only real exception was the Swiss franc, which never appeared in any of the four major crisis portfolios and was a small drag outside them; it stays in the universe mainly as protection against a future crisis centred on the dollar itself.
That is exactly what we want to see from a hedge. Different crises produced different winning portfolios.
Now, the GFC is a good example of both the strengths and weaknesses of the strategy. It had already gained around 33% by June 2008, while global stocks were down only 16%, largely from holding gold and commodities as the Fed cut rates even as inflation and oil prices surged. Then came the downside of using momentum: when the commodity boom abruptly reversed in July and August, the strategy was still holding yesterday’s winners and lost around 13% in two months.
But it then adapted. The portfolio rotated into short equities and the US dollar ahead of Lehman, adding roughly another 20% through the most violent phase of the crisis and ultimately finishing the GFC up almost 39%. Interestingly, long Treasuries - the asset most people associate with 2008 - never became a major position: their strongest rally was too short-lived for the monthly momentum rule, while the dollar delivered a more persistent trend.
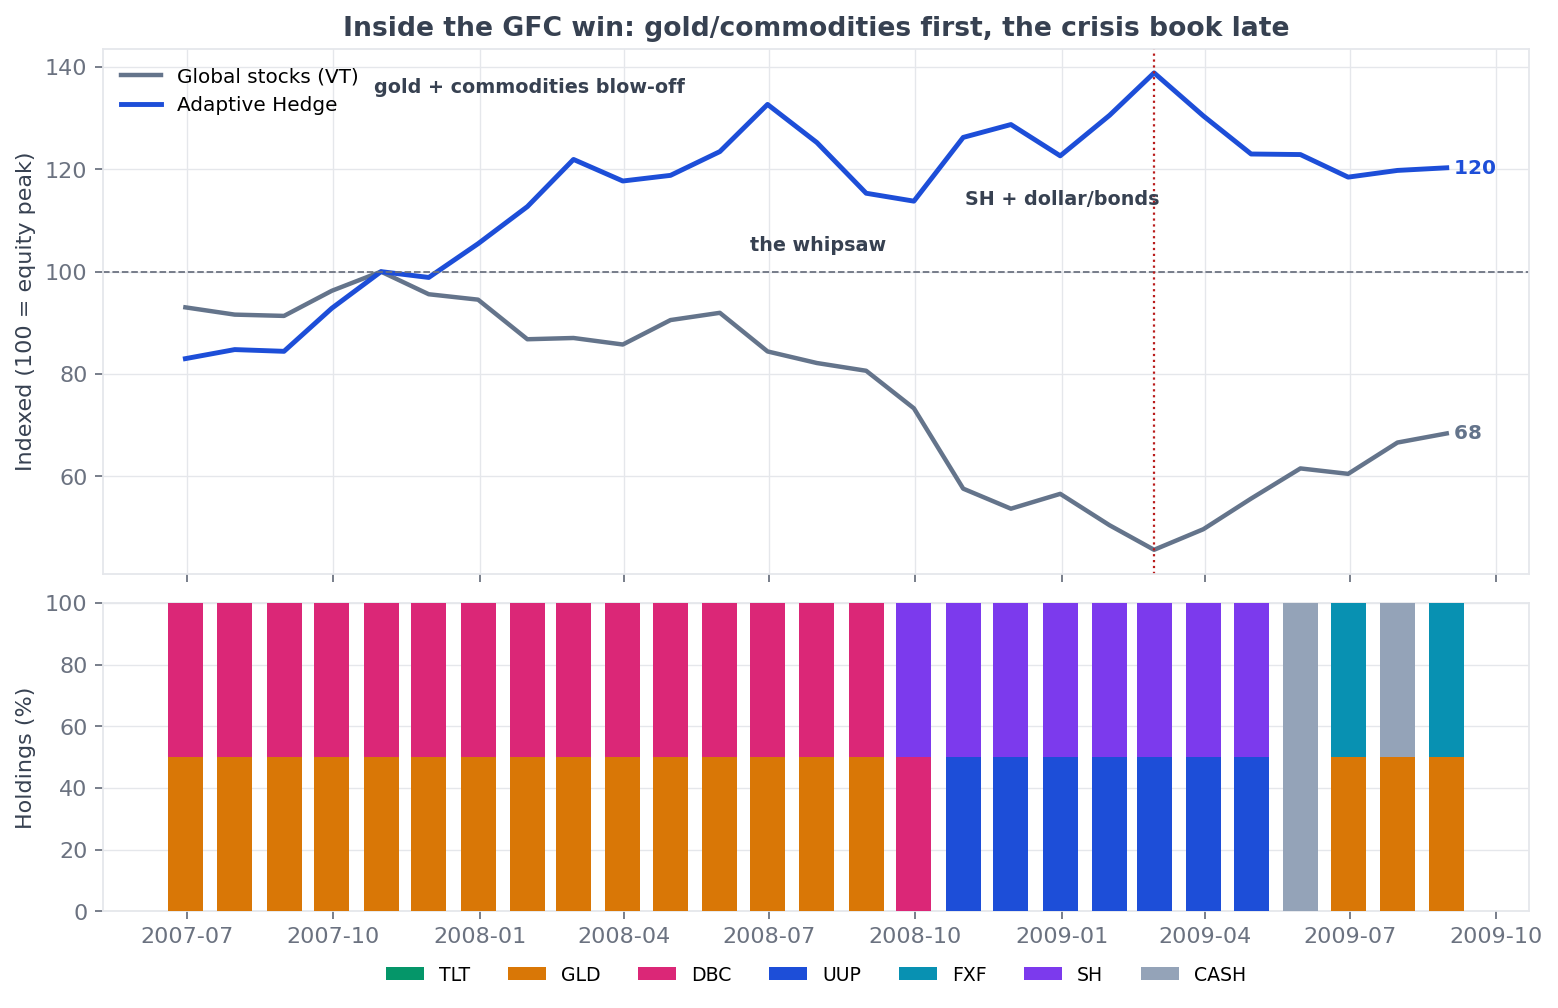 Figure 8. Inside the GFC win.
The dot-com bust shows the strategy dealing with a longer, messier bear market. It entered the decline already holding commodities and the dollar and gained around 25% in the first eight months. The middle phase was harder, with no dominant macro trend and several rotations, but by 2002 the portfolio had shifted toward short equities and gold, adding another 13% into the trough. The trend filter also helped on the way out: commodities were an early winner, but the strategy exited before their subsequent 32% collapse in 2001.
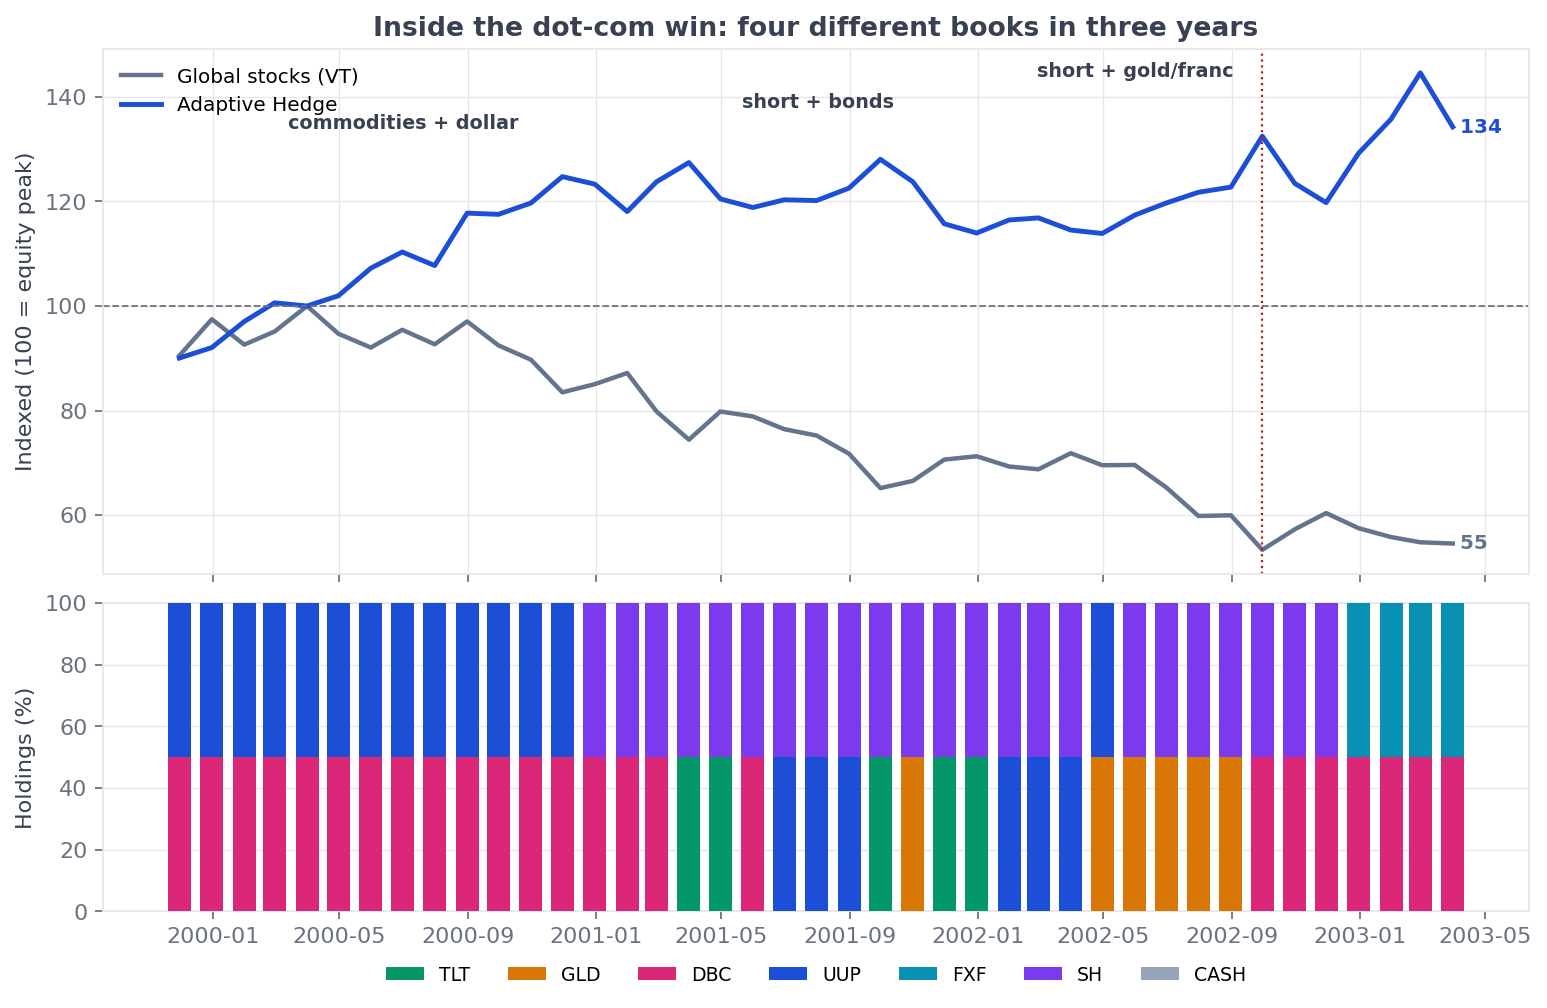 Figure 9. Inside the dot-com win.
2022 and COVID show the two extremes. In 2022, the inflation regime was already well established before stocks peaked, so commodities and the dollar were trending strongly and the strategy gained around 17% during the drawdown. COVID was the opposite: five weeks from peak to trough was too fast for a monthly signal to react, and the hedge worked largely because it already owned bonds and gold going in. One shows the strategy at its best; the other shows why it cannot be relied on as instantaneous crash insurance.
The smaller corrections show the strategy’s weaknesses, however. In the three 10-20% drawdowns, results were mediocre: +2% in 1998, -1% in 2018 and -8% in 2015-16, with the static hedge basket doing better in two of the three. The reason is built into the method: momentum needs a defensive trend to last long enough to become visible, then persist after the signal acts. These episodes did neither. LTCM was over in two months; 2018 came in three separate shocks after an early-year melt-up; and 2015-16 was two sharp selloffs split by a 7% rebound. The strategy arrived late, got whipsawed, or both - sometimes turning assets that made money over the full episode into losing trades.
But the headline returns make the experience look much cleaner than it was. The “right” hedge was often uncomfortable to own in real time - commodities going into a crisis, the dollar instead of Treasuries in 2008, and the hedging portfolio still lost money alongside stocks during parts of the drawdown. Even the biggest wins came with sharp setbacks and several rotations along the way - and that will pressure you psychologically.
Back to our framework, that gives us a fairly clear scorecard: reliability has been good in the major sustained bear markets, but much weaker in smaller corrections. Reactivity has also been good historically, but mostly because the strategy was often already positioned before stocks peaked - not because the monthly signal can react instantly to a crash. That is an important distinction, and not something we should assume will always repeat.
PART III — THE COST OF PROTECTION
The cost of protection
If Part II asked whether the hedge worked, Part III asks the other half of the bargain: what did you have to pay for it?
There is no free lunch in finance. If a hedge protects you when stocks fall, you normally have to pay for it - and the cost can be steep. Rolling 5%-out-of-the-money S&P 500 puts every month lost around 3.3% a year and lost money in 27 of 32 years. A permanent inverse S&P 500 position lost around 9% a year. And a long-VIX fund lost roughly half its value each year since 2011.
Reliable, fast protection exists; it just isn’t cheap. So what did Adaptive Hedge cost?
Over the full period, nothing. It actually made money.
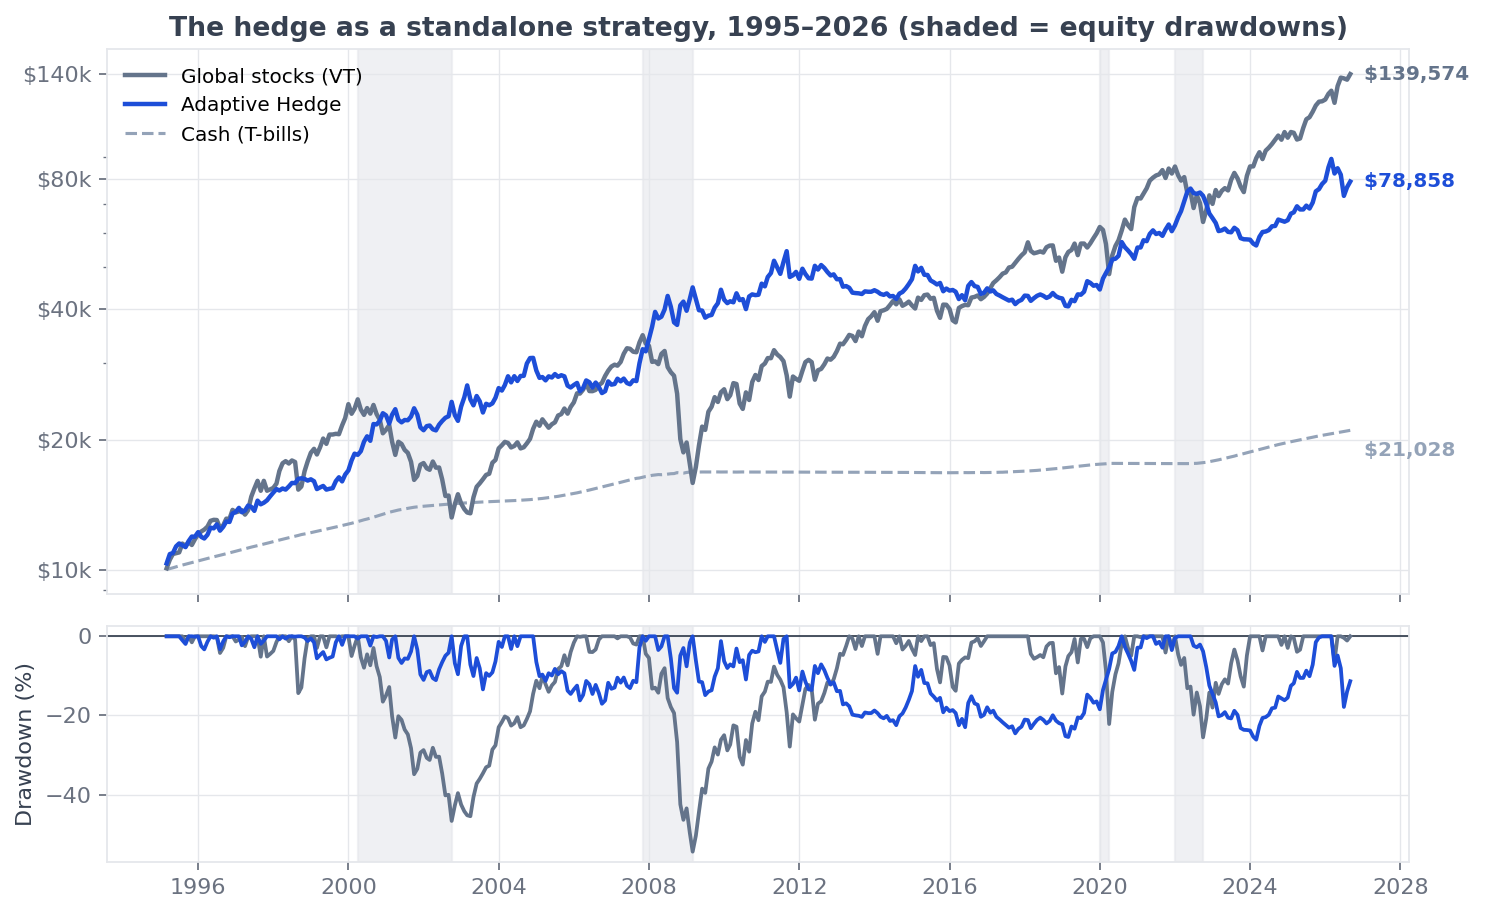 Figure 10. The hedge as a standalone strategy, 1995–2026: growth of $10,000 (log scale) with drawdowns beneath; shaded bands are equity bear markets.
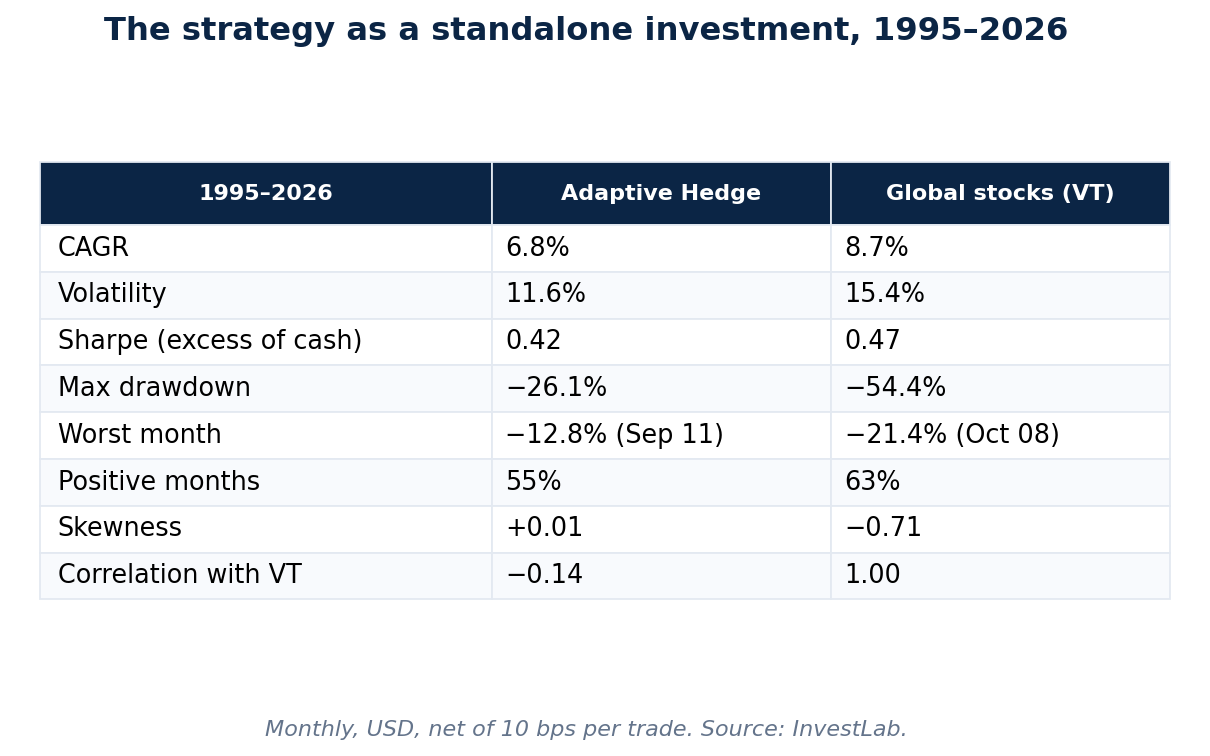 Figure 11. The strategy as a standalone investment, 1995–2026.
From 1995 to 2026, it compounded at 6.8% a year - 4.4 percentage points above cash. $10,000 grew to roughly $79,000, versus about $21,000 in T-bills. It also did so with 11.6% volatility, a 0.42 Sharpe ratio above cash, and a -0.14 correlation with global stocks.
Unlike puts or a permanent short, the hedge didn’t charge you in most years. Only five calendar years lost more than 5%, with 2023 the worst at -10.8%. Most years were positive - and when protection really paid, the gains could be large: +34% in 2000, +27% in 2007 and +25% in 2020.
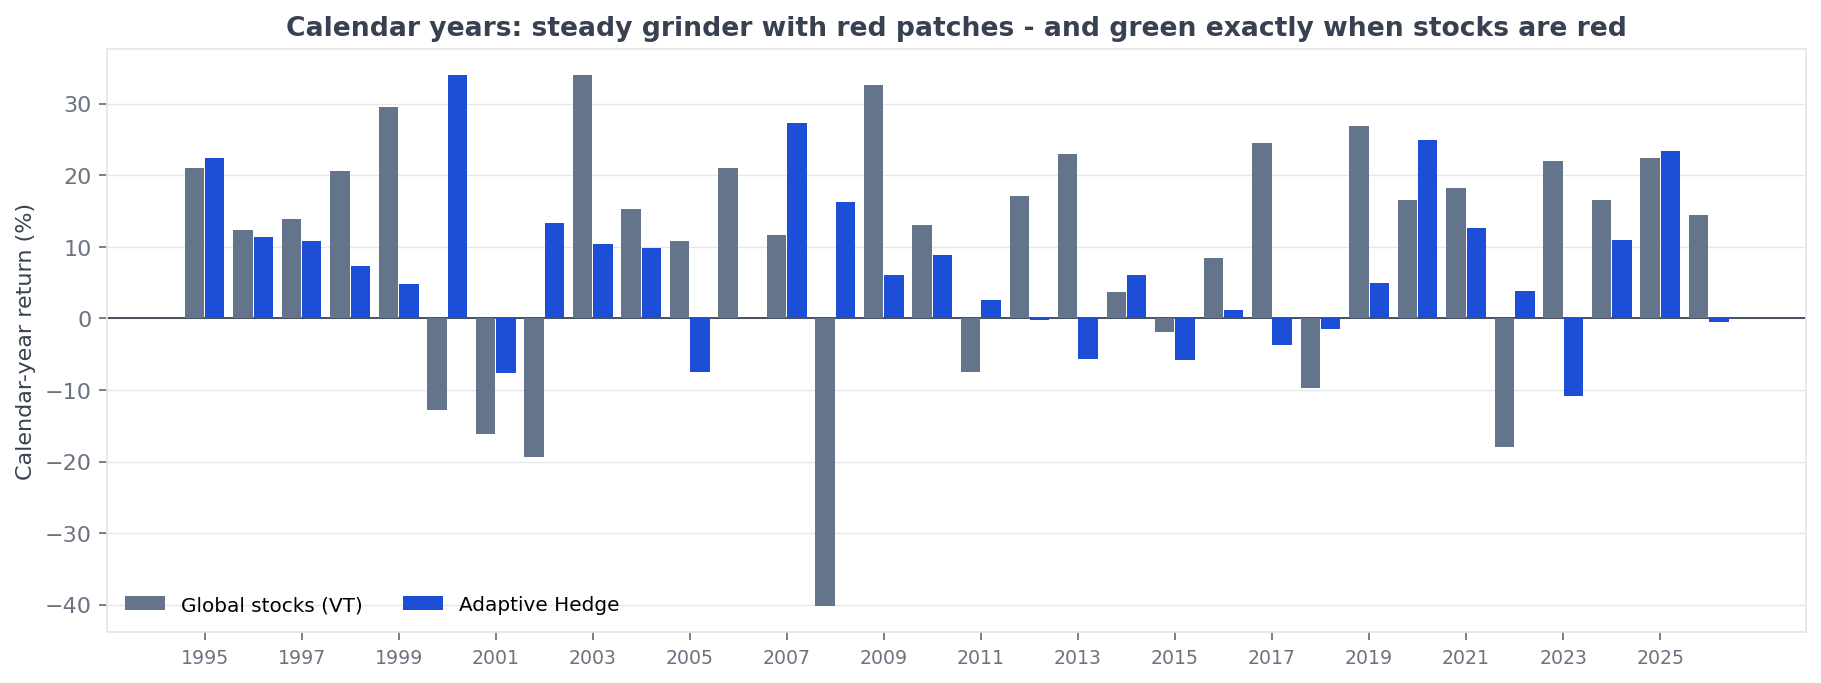 Figure 12. Calendar-year returns, strategy versus global stocks.
That is unusual for a hedge. But again, it does not mean the protection was perfect – or easy to hold. The sleeve still suffered a maximum drawdown of -26%, and during long equity bull markets it could lag cash for years. From 2012 to 2019, for example, it compounded at -0.7% a year versus +0.5% for cash. That is not surprising - a hedge should struggle when there is little to hedge - but it creates a real psychological cost: long stretches where the strategy looks unnecessary while stocks keep rising, increasing the temptation to abandon it before it is needed again.
Where the return came from
The table below splits each asset’s contribution between the four major equity crashes and every other month in the sample.
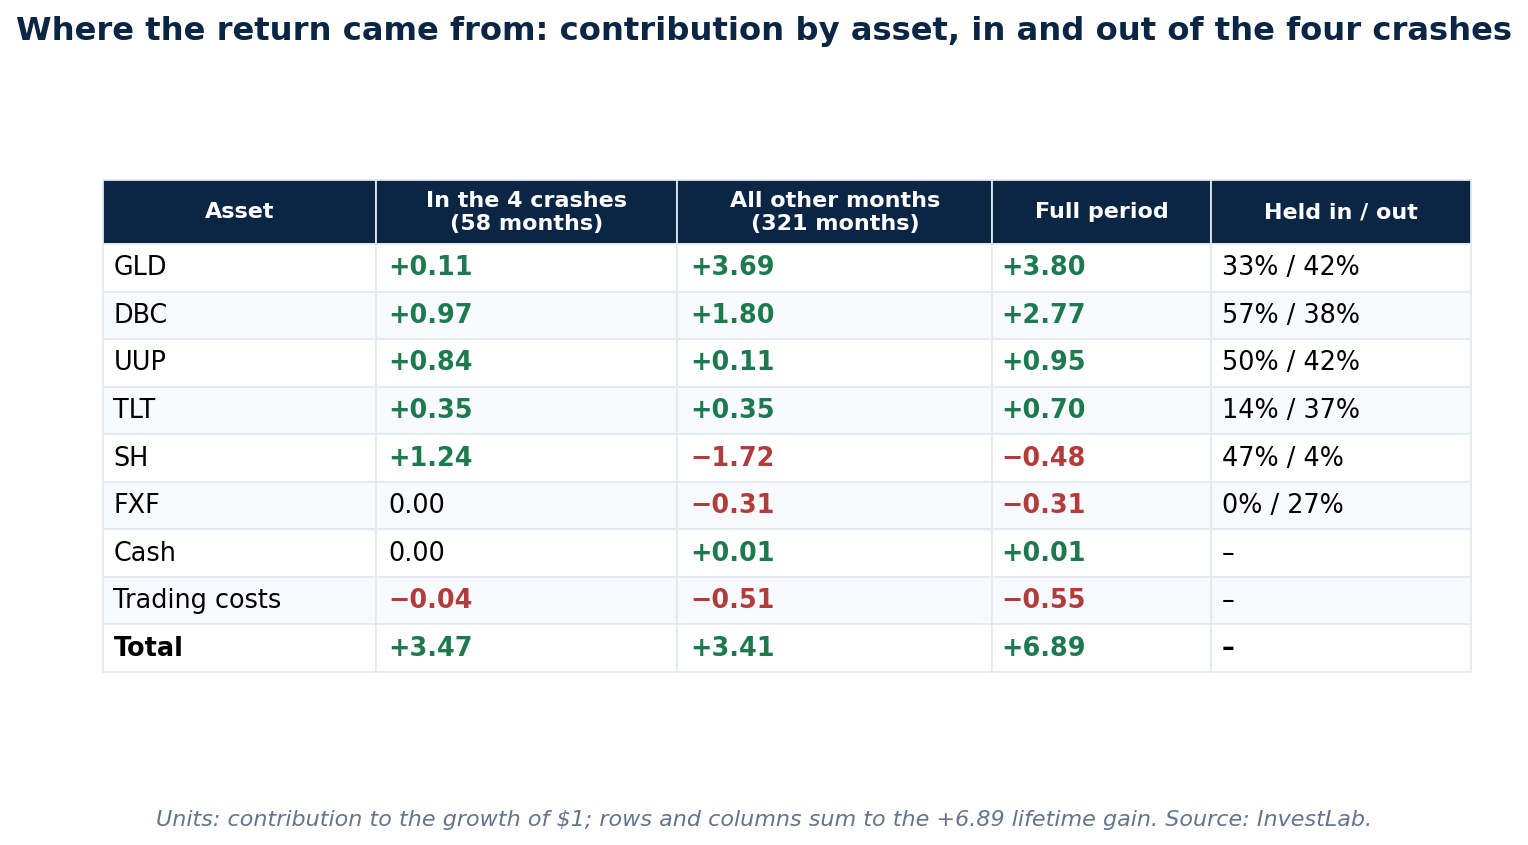 Figure 13. Contribution by asset inside the four crashes and outside them.
The roles are strikingly different.
Short equities behaved like pure insurance. SH contributed strongly during crises and detracted outside them. Crucially, the strategy held it in 47% of crisis months but only 4% of normal months. That is exactly what adaptive selection is supposed to do: use an expensive hedge selectively rather than pay for it all the time.
The US dollar came close to ideal insurance. Almost all of its contribution arrived during the major crashes, with very little cost outside them.
Gold was almost the opposite. Most of its contribution came outside the crash windows, from long trends such as 2001-11 and 2019-26.
Commodities played both roles: useful during inflationary crises, but also profitable during longer commodity bull markets.
That split explains the strategy’s positive long-run return. Only around 15% of months fell inside the four major crisis windows, yet those months generated roughly half of its lifetime gains. The other half came largely from riding persistent trends in defensive assets outside crises.
PART IV — WHY IT WORKED — AND WHY THE EDGE COULD PERSIST
Why it worked — and why the edge could persist
We’re fishing in the right pond. Most traditional hedges come with a built-in cost, but this universe starts from a cheaper base: five of the six assets made money over our sample, and an equal-weight basket earned roughly cash. That does not mean the hedge should keep making money - but nor is there a strong reason to expect a persistent drag. Even with no timing skill at all, random two-asset rotations still averaged about +11% through the GFC and +26% through the dot-com bust. So even if the timing edge proves weaker in future, choosing the right defensive universe already provides a first layer of protection at relatively low cost.
The timing rules worked well - and there is a good reason to expect that edge to persist. A static portfolio with the strategy’s average weights earned 4.4% a year, but only about +7% in the GFC versus +39% adaptively. The strategy was efficient at timing short equities for instance: it held them in 47% of crisis months and just 4% of normal ones. In other words, the rules have historically concentrated exposure when it mattered most - and because that process relies on persistent trends rather than on any one crisis repeating, the mechanism should remain relevant even if the next bear market looks completely different.
That brings us to why timing can work in the first place: many major bear markets are part of slow-moving macro regimes. Inflation shocks, recessions, tightening cycles and funding stress often build over months rather than days. Those forces do not just hit stocks - they can simultaneously create sustained moves in bonds, commodities, currencies and gold. That gives the strategy time to detect which assets are benefiting, often before equities peak and sometimes well after the initial selloff. The strategy does not need to predict the crisis or even understand its cause in real time; it only needs the underlying regime to persist long enough to leave a trend in prices.
Momentum gives the strategy a way to identify those winners. Slow-moving macro forces are one reason trends can persist; investor underreaction, institutional constraints and feedback effects are others as we explained in more detail in Dual Momentum Pivot5. More importantly, momentum is arguably the most robust anomaly in finance, documented across centuries, multiple asset classes, out-of-sample, and specifically as a crisis hedge. There are also good reasons it may survive despite being well known: it is hard to hold through long dry spells and it is divergent: it adds exposure to moves already underway, so new capital can reinforce a trend rather than automatically arbitrage it away. That makes the result much more credible than if it appeared only in this backtest.
The robustness tests back that up. Random two-asset rotations from the same universe earned just 1.5% a year versus 6.8% for the strategy, and only one in a thousand did better. The excess return over cash has a t-statistic of about 2.4, and the result stays ahead of cash from every start date while making money in three of the four decades, with only the 2010s roughly flat. Reasonable multi-horizon variants still returned around 6.6% to 7.4% a year, even 50 bps per trade left about 5.2%, and removing any single asset did not materially change the overall conclusion. None of that makes the backtest bulletproof, but it makes curve-fitting, one lucky parameter, one lucky asset or one lucky period much less convincing explanations.
PART V — WHEN AND WHY THE STRATEGY COULD FAIL
When and why the strategy could fail
The first weakness comes straight from the weaknesses of momentum. The strategy needs persistent trends. Choppy markets create whipsaws, sharp reversals leave it holding yesterday’s winners, and crashes that unfold between monthly rebalances can simply move too fast. The numbers make that clear: the top-ranked asset’s momentum score averaged 26% through the GFC, but only 4% during the 2015-16 correction. Momentum works when trends persist; it struggles when they are weak or reverse before the signal can catch up. And as we saw in Part II, even during successful bear-market episodes the protection was rarely smooth - the hedge could still lose money alongside stocks before the trend reasserted itself.
The biggest strategy-specific risk is owning the wrong hedge. Holding only two assets makes the payoff meaningful when you are right, but concentration cuts both ways. In the 38 worst months for stocks, the strategy still lost money about a third of the time. September 2011 was the clearest miss: the hedge fell 12.8% while stocks lost 10.7%, as a global margin call hit gold and commodities together. It also lost money in 2015-16 and 2018, when no clear defensive trend emerged. COVID is another useful warning: the crash was too fast for the signal, and the strategy worked largely because it already owned bonds and gold.
It is not a short-term hedge, and it cannot protect against everything. Every hedge trades off cost, reliability and speed. Put options or simply owning less equity react immediately, but you pay for that certainty. This strategy sits elsewhere on the spectrum: cheaper to carry, but potentially slower and not guaranteed to always work. It needs the underlying regime to persist for months. If what you need is guaranteed protection against next month’s selloff, this is the wrong tool.
The historical evidence is also thinner than the headline numbers suggest. The biggest wins come from a small number of major bear markets, and the exact payoff is sensitive to specification. A simple 12-month momentum rule would have lost 12.5% in the GFC where the blended signal gained 39%, and skipping the latest month of data cuts that gain to +16%. There is also unavoidable hindsight in choosing assets already known to behave differently in past crises. So the mechanism deserves more confidence than any single backtest number.
The hedge also needs to be in place before the crisis becomes obvious. Waiting until stocks first closed 10% below their peak before implementing the strategy produced zero or negative protection in every crash since 2008. That is consistent with the whole design: this is a slow-moving trend hedge, not something you can switch on after the selloff has already started.
The future may be less generous than the past. Much of the strategy’s carry came from powerful gold and commodity trends, and returns were far stronger before 2010 - 10.1% a year versus 3.8% afterwards. Future crises may also take forms this universe handles poorly: tightening-led recoveries can whipsaw the hedge, deflationary shocks may lean heavily on bonds, and a crisis centred on the US dollar could pressure several positions at once. A sensible planning assumption is therefore lower carry, with the protection itself doing most of the work.
And the final failure mode is behavioural. The strategy spent 44% of all months more than 10% below its own high-water mark, went nowhere for much of 2012-19, and lost 10.8% in 2023 while stocks gained 22%. Economically, that is not the worst time for a hedge to disappoint because the rest of the portfolio is probably doing well. Psychologically, it may be the hardest. Years of watching protection look unnecessary are exactly what make investors abandon it before the next regime change. The rules are easy to follow; sticking with them is the real test.
PART VI — IS IT THE RIGHT STRATEGY FOR YOU, AND IF SO WHAT NEXT?
Is it the right strategy for you, and if so what next?
Start with the trade-off. Adaptive Hedge is designed for investors who want to keep a large allocation to stocks but add protection against deep, sustained bear markets. Its main advantage is cost: historically, it made money over the full period rather than steadily losing money like many permanent hedges. But you give something up in return: the protection is less certain and can be slower to arrive. It can miss smaller corrections, hold the wrong hedge for a while, or react too late to a very fast crash.
It might be a good fit if:
- Most of your portfolio is in stocks and you want to keep it that way
- You are mainly worried about a major bear market like 2000-02 or 2008, rather than a small 10-15% correction
- You can spend around 15 minutes a month following fixed rules
- You can tolerate periods when the hedge looks wrong, loses money or badly trails stocks.
It is a bad fit if you need guaranteed or immediate protection, would rely on it to keep you solvent, plan to lever against it, already run a broadly diversified all-weather portfolio, or know you tend to chase recent performance or suffer from FOMO.
It is especially useful if you want to keep the rest of your portfolio simple. Dual Momentum Pivot5 rotates the whole portfolio. Adaptive Hedge does something narrower: it leaves your long-term stock holdings alone and trades only the hedge. That means fewer changes to your main portfolio and potentially fewer taxable trades. If you have limited tax-sheltered account space, the hedge is the part I would prioritise putting there.
Before you implement it, write down why you want it and what pain you are willing to tolerate:
I’m using this strategy because I want lower-cost protection against deep, sustained bear markets while keeping my equity core intact. I accept that it may miss some corrections, react too slowly to fast crashes, hold positions that feel counterintuitive, suffer whipsaws even during successful bear-market episodes, fall 25-30% on its own and lag for years. I will judge it over full market regimes, not a few bad months.
Also decide in advance what would genuinely make you stop. Not a bad year, a 25-30% drawdown or years of lagging stocks - all of those happened in the backtest. The warning signs should be more structural: repeated failure during sustained bear markets, defensive assets no longer developing persistent trends when stocks are under stress, or a long stretch where the strategy materially trails cash despite behaving as designed. Those are reasons to revisit the thesis; ordinary frustration is not.
How to implement it
You can absolutely run Adaptive Hedge yourself with a spreadsheet and about 15 minutes a month - everything you need is in Part I.
But don’t let it become another strategy you read about, agree with, and then forget. Follow it live for a few months. See what it owns, how rarely it trades, and how you react when the signal looks wrong or the hedge seems unnecessary. That is how you really learn the strategy - and, over time, become a better investor.
InvestLab is built to make that whole process easier - from following it live, to testing it for yourself, to eventually implementing it with real money.
The portfolio today
The strategy rebalances at the end of each month. Rather than freeze one month’s positions into this article, here is the live strategy — current holdings, performance and trade history, always up to date:
Important information — please read. This guide is published by InvestLab for educational and informational purposes only and does not constitute investment advice, a personal recommendation, regulated advice, investment management, or an offer or solicitation to buy or sell any financial instrument. InvestLab is not authorised or regulated by the Financial Conduct Authority, the Comisión Nacional del Mercado de Valores, or any other financial regulator, and reading this guide, subscribing, or corresponding with the author does not create an adviser-client or fiduciary relationship. Any tickers named (including TLT, GLD, DBC, UUP, FXF, SH, BIL and VT) are referenced solely to illustrate the mechanics of the strategy. The strategy is presented as a systematic portfolio construction case study and may not be suitable for your objectives, financial situation, tax position, risk tolerance or jurisdiction. All backtested performance is hypothetical, produced with hindsight, and subject to material limitations, including proxy data where today's funds did not exist, estimated costs (10 basis points per trade), liquidity assumptions, taxes, slippage, and the risk that live results fall short of historical results. Past performance, whether actual or hypothetical, is not a reliable indicator of future returns. The strategy can lose money, may fail to protect in a given crisis, uses an inverse ETF whose daily reset can cause decay, and could suffer losses larger than those shown historically. The author may invest in this strategy or related instruments, and InvestLab is a commercial product, so conflicts of interest may exist. Nothing here is tax advice, and you should consult an authorised financial adviser and/or tax professional before acting. You alone are responsible for your investment decisions, and InvestLab and its author accept no liability for losses arising from the use of this material.
For information and education only — nothing here is investment advice. Backtested and live results are shown with their assumptions; past performance does not guarantee future returns.